Page 143 - Suncor AR English
P. 143
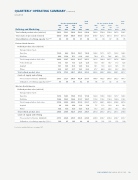
QUARTERLY OPERATING SUMMARY
(continued)
(unaudited)


Total Total
For the Quarter Ended Year
For the Quarter Ended Year
Mar June Sept Dec Mar June Sept
Dec
31 30 30 31
31 30 30 31
Refining and Marketing
2012 2012 2012 2012 2012
2013 2013 2013 2013 2013

542.2 532.1 568.6 528.2 542.9
Total refined product sales (mbbls/d) 503.8 550.4 550.4 547.2 538.5
.......................................................................................................................................................................................................................................................
Total crude oil processed (mbbls/d) 443.0 414.5 448.8 419.0 431.3 419.8 427.2 441.4 437.0 431.4
.......................................................................................................................................................................................................................................................
Total utilization of refining capacity (%)*** 96 90 98 91 94 92 94 97 96 95

Eastern North America
.......................................................................................................................................................................................................................................................
Refined product sales (mbbls/d)
.......................................................................................................................................................................................................................................................
.......................................................................................................................................................................................................................................................
Transportation fuels

Gasoline 122.0 96.9 125.2 120.1 116.0 120.8 127.1 127.1 123.3 124.5 .......................................................................................................................................................................................................................................................
Distillate 84.9 113.8 76.1 81.6 89.1 70.4 67.3 78.6 84.3 75.5

Total transportation fuel sales 206.9 210.7 201.3 201.7 205.1 191.2 194.4 205.7 207.6 200.0
.......................................................................................................................................................................................................................................................
Petrochemicals 11.3 15.1 11.3 12.8 12.6 13.8 14.5 10.7 11.3 12.6
.......................................................................................................................................................................................................................................................
Asphalt 10.1 13.8 25.8 14.9 16.2 10.1 13.8 22.0 14.5 15.1 .......................................................................................................................................................................................................................................................

Other 33.3 32.7 27.7 19.5 28.3 27.7 44.0 30.8 32.7 34.0
Total refined product sales 261.6 272.3 266.1 248.9 262.2 242.8 266.7 269.2 266.1 261.7

Crude oil supply and refining
.......................................................................................................................................................................................................................................................
Processed at refineries (mbbls/d) 205.7 212.1 206.9 182.4 201.7 190.8 192.5 205.0 202.3 197.7 .......................................................................................................................................................................................................................................................
Utilization of refining capacity (%)*** 93 96 93 82 91 86 87 92 91 89


Western North America
.......................................................................................................................................................................................................................................................
Refined product sales (mbbls/d) .......................................................................................................................................................................................................................................................

.......................................................................................................................................................................................................................................................
Transportation fuels
Gasoline 125.8 128.3 139.6 131.3 131.4 122.0 130.8 134.0 127.7 128.3
.......................................................................................................................................................................................................................................................
Distillate 129.6 102.5 129.6 121.7 120.7 115.8 118.3 114.4 128.9 119.5

Total transportation fuel sales 255.4 230.8 269.2 253.0 252.1 237.8 249.1 248.4 256.6 247.8
.......................................................................................................................................................................................................................................................
Asphalt 8.8 12.0 14.4 11.8 11.8 7.5 11.3 12.0 9.4 10.1 .......................................................................................................................................................................................................................................................
Other 16.4 17.0 18.9 14.5 16.8 15.7 23.3 20.8 15.1 18.9

Total refined product sales 280.6 259.8 302.5 279.3 280.7 261.0 283.7 281.2 281.1 276.8

Crude oil supply and refining
.......................................................................................................................................................................................................................................................
Processed at refineries (mbbls/d) 237.3 202.4 241.9 236.6 229.6 229.0 234.7 236.4 234.7 233.7 .......................................................................................................................................................................................................................................................
Utilization of refining capacity (%)*** 100 85 102 99 96 98 101 101 101 100


Footnotes and definitions, see page 147.


SUNCOR ENERGY INC. ANNUAL REPORT 2013 139