Page 141 - Suncor AR English
P. 141
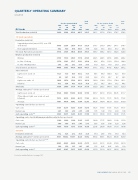
QUARTERLY OPERATING SUMMARY

(unaudited)


Total Total
For the Quarter Ended
Year
For the Quarter Ended Year
Mar June Sept Dec Mar June Sept Dec
31 30 30 31 31 30 30 31
Oil Sands
2013 2013
2013 2013
2013 2012
2012 2012 2012 2012

Total Production (mbbls/d) 389.0 309.4
423.6 446.5
337.8 378.9 378.7 359.2
392.5 341.1


Oil Sands operations
.......................................................................................................................................................................................................................................................
Production (mbbls/d)
.......................................................................................................................................................................................................................................................
Upgraded product (sweet SCO, sour SCO
and diesel) 308.6 220.6 299.0 301.5 282.6 273.1 253.9 298.3 281.1 276.7
.......................................................................................................................................................................................................................................................
Non-upgraded bitumen 49.2 56.0 97.4 108.1 77.9 32.6 55.3 43.0 61.7 48.1

Oil Sands Operations production 357.8 276.6 396.4 409.6 360.5 305.7 309.2 341.3 342.8 324.8

Bitumen production (mbbls/d) .......................................................................................................................................................................................................................................................
Mining 278.9 181.0 299.9 317.4 269.8 262.5 244.5 287.6 269.6 266.2
.......................................................................................................................................................................................................................................................
In Situ – Firebag 137.0 129.3 152.7 154.1 143.4 83.6 95.8 113.0 123.4 104.0
.......................................................................................................................................................................................................................................................
In Situ – MacKay River 28.5 28.2 29.2 28.3 28.5 31.0 32.0 17.0 27.9 27.0

Total bitumen production 444.4 338.5 481.8 499.8 441.7 377.1 372.3 417.6 420.9 397.2
Sales (mbbls/d)
.......................................................................................................................................................................................................................................................
Light sweet crude oil 112.7 51.0 99.0 103.2 91.5 89.5 98.9 104.4 82.3 93.8
.......................................................................................................................................................................................................................................................
Diesel 9.0 28.7 28.6 27.5 23.5 32.8 27.0 28.7 9.7 24.5
.......................................................................................................................................................................................................................................................
Light sour crude oil 190.6 147.9 159.9 166.1 166.0 183.0 110.9 175.9 174.4 161.1 .......................................................................................................................................................................................................................................................

Bitumen 47.1 56.4 84.3 115.0 76.0 27.5 56.7 36.4 57.3 44.5
Total sales 359.4 284.0 371.8 411.8 357.0 332.8 293.5 345.4 323.7 323.9

Average sales price(1) (dollars per barrel)
.......................................................................................................................................................................................................................................................
Light sweet crude oil 95.24 99.45 110.80 88.06 97.98 98.57 88.18 87.84 90.76 91.17 .......................................................................................................................................................................................................................................................
Other (diesel, light sour crude oil and

bitumen) 70.72 80.79 93.92 66.15 77.62 88.14 73.79 77.73 70.79 77.83
.......................................................................................................................................................................................................................................................
Average 78.41 84.14 98.42 71.64 82.83 90.95 78.64 80.79 75.87 81.69

Operating costs (dollars per barrel)
.......................................................................................................................................................................................................................................................
Cash costs 31.95 42.75 30.30 33.90 34.10 36.25 37.60 31.85 35.20 35.15
.......................................................................................................................................................................................................................................................
Natural gas 2.85 3.80 2.30 2.95 2.90 1.85 1.40 1.50 2.80 1.90
Cash operating costs*(2) 34.80 46.55 32.60 36.85 37.00 38.10 39.00 33.35 38.00 37.05

Operating costs – In situ bitumen production only (dollars per barrel)
.......................................................................................................................................................................................................................................................
Cash costs 11.40 10.90 11.00 12.05 11.35 18.80 17.75 14.60 11.90 15.50
.......................................................................................................................................................................................................................................................
Natural gas 5.40 5.80 4.15 5.45 5.15 3.65 3.05 3.40 5.20 3.90
Cash operating costs*(2) 16.80 16.70 15.15 17.50 16.50 22.45 20.80 18.00 17.10 19.40


Syncrude
.......................................................................................................................................................................................................................................................
Production (mbbls/d) 31.2 32.8 27.2 36.9 32.0 35.4 28.6 37.6 35.9 34.4

Average sales price(1) (dollars per barrel) 95.51 100.92 113.57 92.26 99.82 98.82 90.61 90.24 90.90 92.69

Operating costs (dollars per barrel)**** .......................................................................................................................................................................................................................................................

Cash costs 40.45 40.95 48.90 38.20 41.75 32.25 52.15 33.40 37.60 38.10 .......................................................................................................................................................................................................................................................
Natural gas 1.60 1.50 1.25 1.45 1.45 1.25 0.95 0.95 1.60 1.20

Cash operating costs*(2) 42.05 42.45 50.15 39.65 43.20 33.50 53.10 34.35 39.20 39.30


Footnotes and definitions, see page 147.


SUNCOR ENERGY INC. ANNUAL REPORT 2013 137