Page 140 - Suncor AR English
P. 140
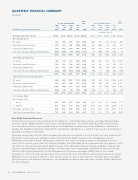
QUARTERLY FINANCIAL SUMMARY

(unaudited)


Total Total
For the Quarter Ended Year
For the Quarter Ended Year
Mar June Sept Dec Mar June Sept
Dec
31 30 30 31
31 30 30 31
($ millions except per share amounts)
2013 2013 2013 2013 2013
2012 2012 2012 2012 2012

(restated – note 6)

Revenues and other income 10016 9714 10373 10194 40297
9755 9707 9576 9488 38526

Net earnings (loss)
.......................................................................................................................................................................................................................................................
Oil Sands 326 294 951 469 2 040 609 359 537 (1 037) 468
.......................................................................................................................................................................................................................................................
Exploration and Production 354 301 446 (101) 1 000 332 (430) 88 148 138
.......................................................................................................................................................................................................................................................
Refining and Marketing 782 432 350 458 2 022 476 501 710 450 2 137
.......................................................................................................................................................................................................................................................
Corporate, Energy Trading and Eliminations (368) (347) (53) (383) (1 151) 29 (106) 209 (135) (3)

1 094 680 1 694 443 3 911 1 446 324 1 544 (574) 2 740
Operating earnings (loss)
.......................................................................................................................................................................................................................................................
Oil Sands 453 294 951 400 2 098 609 429 537 450 2 025
.......................................................................................................................................................................................................................................................
Exploration and Production 354 301 316 239 1 210 332 287 88 143 850 .......................................................................................................................................................................................................................................................

Refining and Marketing 782 432 350 458 2 022 476 516 710 450 2 152 .......................................................................................................................................................................................................................................................
Corporate, Energy Trading and Eliminations (222) (93) (191) (124) (630) (99) 17 (43) (55) (180)

1 367 934 1 426 973 4 700 1 318 1 249 1 292 988 4 847

Cash flow from (used in) operations
.......................................................................................................................................................................................................................................................

Oil Sands 848 896 1 702 1 110 4 556 1 118 943 1 256 1 090 4 407 .......................................................................................................................................................................................................................................................
Exploration and Production 690 668 406 552 2 316 677 656 365 529 2 227
.......................................................................................................................................................................................................................................................
Refining and Marketing 1 067 646 371 534 2 618 730 711 1 063 634 3 138
.......................................................................................................................................................................................................................................................
Corporate, Energy Trading and Eliminations (321) 40 49 154 (78) (110) 37 59 (25) (39)

2 284 2 250 2 528 2 350 9 412 2 415 2 347 2 743 2 228 9 733
Per common share
.......................................................................................................................................................................................................................................................
Net earnings (loss)
.......................................................................................................................................................................................................................................................
– basic 0.72 0.45 1.13 0.30 2.61 0.93 0.21 1.01 (0.38) 1.77
.......................................................................................................................................................................................................................................................
– diluted 0.71 0.45 1.13 0.30 2.60 0.92 0.20 1.00 (0.38) 1.76 .......................................................................................................................................................................................................................................................

Operating earnings – basic 0.90 0.62 0.95 0.66 3.13 0.84 0.80 0.84 0.65 3.14 .......................................................................................................................................................................................................................................................
Cash flow from operations – basic 1.50 1.49 1.69 1.58 6.27 1.55 1.51 1.79 1.46 6.30


Non GAAP Financial Measures
Certain financial measures in the remainder of this document – namely operating earnings, cash flow from operations,

return on capital employed (ROCE) and Oil Sands cash operating costs – are not prescribed by GAAP. Suncor includes
these financial measures because investors may use this information to analyze operating performance, leverage and

liquidity. The additional information should not be considered in isolation or as a substitute for measures of performance
prepared in accordance with GAAP.

Operating earnings (loss) and Oil Sands cash operating costs for each quarter in 2012 and 2013 are each defined in the

Non-GAAP Financial Measures Advisory section and reconciled to GAAP measures in the Consolidated Financial
Information and Segment Results and Analysis sections of each respective quarterly Report to Shareholders issued in

respect of the relevant quarter for 2013 (Quarterly Reports). Cash flow from (used in) operations for each quarter in 2012
and 2013 are defined and reconciled to GAAP measures in the Non GAAP Financial Measures Advisory section of each

respective Quarterly Report. Operating earnings, cash flow from (used in) operations, and ROCE for each of 2010 and
2009 are defined and reconciled in Suncor’s Management’s Discussion and Analysis (MD&A) for the year ended

December 31, 2010. Oil Sands cash operating costs per barrel for 2010 and 2009 are defined and reconciled in Suncor’s
MD&A for the year ended December 31, 2011 and December 31, 2010, respectively. The remainder of the non-GAAP
financial measures not otherwise mentioned in this paragraph are defined and reconciled in Suncor’s MD&A contained in

this Annual Report.


136 SUNCOR ENERGY INC. ANNUAL REPORT 2013