Page 142 - Suncor AR English
P. 142
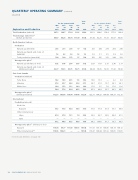
QUARTERLY OPERATING SUMMARY
(continued)
(unaudited)


Total Total
For the Quarter Ended Year
For the Quarter Ended Year
Mar June Sept Dec Mar June Sept
Dec
31 30 30 31
31 30 30 31
Exploration and Production
2012 2012 2012 2012 2012
2013 2013 2013 2013 2013

221.2 204.6 156.4 177.8 189.9 Total Production (mboe/d) 207.1 190.7 171.4 111.6 169.9
.......................................................................................................................................................................................................................................................
Total Average Sales Price(1)
(dollars per barrel) 90.67 84.28 88.74 111.99 91.44 91.94 82.25 77.33 83.87 84.05


North America Onshore
.......................................................................................................................................................................................................................................................
Production
.......................................................................................................................................................................................................................................................
Natural gas (mmcf/d) 263 251 238 17 192 323 294 279 264 290
.......................................................................................................................................................................................................................................................
Natural gas liquids and crude oil
(mbbls/d) 7.6 6.2 5.8 1.6 5.3 5.8 5.1 5.5 5.9 5.6
.......................................................................................................................................................................................................................................................
Total production (mmcfe/d) 309 289 273 27 224 358 325 312 299 323

Average sales price(1)
.......................................................................................................................................................................................................................................................
Natural gas (dollars per mcf) 3.02 3.46 2.68 3.65 3.42 2.03 1.63 2.15 2.96 2.17
.......................................................................................................................................................................................................................................................
Natural gas liquids and crude oil
(dollars per barrel) 82.77 78.61 83.75 76.71 81.34 84.34 79.25 72.91 71.43 76.93


East Coast Canada
.......................................................................................................................................................................................................................................................
Production (mbbls/d) .......................................................................................................................................................................................................................................................
Terra Nova 14.2 16.8 20.5 5.6 14.2 19.6 13.3 — 2.2 8.8
.......................................................................................................................................................................................................................................................
Hibernia 27.8 25.7 28.8 25.8 27.1 28.7 31.0 15.7 29.1 26.1
.......................................................................................................................................................................................................................................................
White Rose 16.4 15.3 13.1 14.9 14.9 17.0 5.5 7.0 17.0 11.6

58.4 57.8
62.4 46.3 56.2
65.3 49.8
22.7 48.3 46.5
Average sales price(1)

(dollars per barrel) 112.57 103.68
116.94 116.48 112.39
122.31 104.25
108.49 108.37 112.15

International
.......................................................................................................................................................................................................................................................
Production (mboe/d)
.......................................................................................................................................................................................................................................................
North Sea
.......................................................................................................................................................................................................................................................
Buzzard 55.3 57.8 50.4 59.8 55.8 57.0 57.9 41.9 35.3 48.0
.......................................................................................................................................................................................................................................................
Other International
.......................................................................................................................................................................................................................................................
Libya 41.9 27.0 13.1 1.0 20.6 39.2 42.7 39.8 44.4 41.5
.......................................................................................................................................................................................................................................................
Syria ————— —————

97.2 84.8 63.5 60.8 76.4 96.2 100.6 81.7 79.7 89.5
Average sales price(1) (dollars per boe)
.......................................................................................................................................................................................................................................................
Buzzard 110.94 99.77 111.00 108.53 107.44 111.83 103.18 104.06 104.19 106.12
.......................................................................................................................................................................................................................................................
Other International** 110.36 104.21 — — 107.94 118.47 109.44 107.32 108.05 110.65


Footnotes and definitions, see page 147.


138 SUNCOR ENERGY INC. ANNUAL REPORT 2013