Page 144 - Suncor AR English
P. 144
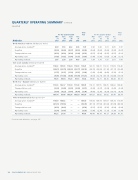
QUARTERLY OPERATING SUMMARY
(continued)

(unaudited)


Total Total
For the Quarter Ended Year
For the Quarter Ended Year
Mar June Sept Dec Mar June Sept
Dec

Netbacks
31 30 30 31
31 30 30 31
2012 2012 2012 2012 2012
2013 2013 2013 2013 2013
North America Onshore (dollars per mcfe)
.......................................................................................................................................................................................................................................................
Average price realized(3) 4.89 5.58 4.62 8.86 5.07 3.98 3.48 3.81 4.65 3.97
.......................................................................................................................................................................................................................................................
Royalties (0.58) (0.49) (0.37) (0.52) (0.54) (0.24) (0.20) (0.28) (0.38) (0.27)
.......................................................................................................................................................................................................................................................
Transportation costs (0.23) (0.28) (0.34) (1.94) (0.33) (0.27) (0.34) (0.35) (0.27) (0.31) .......................................................................................................................................................................................................................................................

Operating costs (1.43) (1.82) (1.84) (1.75) (1.69) (1.48) (1.56) (1.63) (1.39) (1.51)
Operating netback 2.65 2.99 2.07 4.65 2.51 1.99 1.38 1.55 2.61 1.88

East Coast Canada (dollars per barrel)
.......................................................................................................................................................................................................................................................
Average price realized(3) 114.32 105.83 118.24 118.83 114.25 123.73 106.73 112.91 110.69 114.46 .......................................................................................................................................................................................................................................................

Royalties (26.61) (23.70) (30.23) (32.77) (28.16) (34.72) (38.83) (31.16) (27.17) (33.40) .......................................................................................................................................................................................................................................................
Transportation costs (1.75) (2.15) (1.30) (2.35) (1.86) (1.42) (2.48) (4.42) (2.32) (2.31)
.......................................................................................................................................................................................................................................................
Operating costs (9.05) (11.44) (9.46) (15.90) (11.21) (8.53) (12.71) (33.17) (12.00) (13.57)

Operating netback 76.91 68.54 77.25 67.81 73.02 79.06 52.71 44.16 69.20 65.18
North Sea – Buzzard (dollars per barrel)
.......................................................................................................................................................................................................................................................
Average price realized(3) 113.33 102.17 113.30 111.43 109.95 114.13 105.55 106.35 106.62 108.46
.......................................................................................................................................................................................................................................................
Transportation costs (2.39) (2.40) (2.30) (2.90) (2.51) (2.30) (2.37) (2.29) (2.43) (2.34)
.......................................................................................................................................................................................................................................................
Operating costs (5.80) (6.29) (7.64) (4.94) (5.94) (4.80) (3.36) (8.24) (10.71) (6.38)

Operating netback 105.14 93.48 103.36 103.59 101.50 107.03 99.82 95.82 93.48 99.74
Other International (dollars per boe)**
.......................................................................................................................................................................................................................................................
Average price realized(3) 110.69 104.62 — — 108.30 118.84 109.79 107.67 108.34 110.99
.......................................................................................................................................................................................................................................................
Royalties (41.81) (79.56) — — (56.70) (67.13) (57.50) (61.02) (81.09) (66.93)
.......................................................................................................................................................................................................................................................
Transportation costs (0.33) (0.41) — — (0.36) (0.37) (0.35) (0.35) (0.29) (0.34) .......................................................................................................................................................................................................................................................

Operating costs (3.34) (3.47) — — (3.39) (1.86) (2.76) (1.13) (1.97) (1.94)
Operating netback 65.21 21.18 — — 47.85 49.48 49.18 45.17 24.99 41.78


Footnotes and definitions, see page 147.


140 SUNCOR ENERGY INC. ANNUAL REPORT 2013