Page 145 - Suncor AR English
P. 145
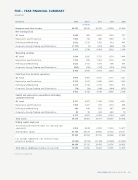
FIVE – YEAR FINANCIAL SUMMARY

(unaudited)


($ millions)
2013
2012(A) 2011
2010
2009

(restated)

Revenues and other income 40 297
38 526
38 792
32 604
25 480

Net earnings (loss)
.......................................................................................................................................................................................................................................................

Oil Sands 2040 468 2603 1520 557 .......................................................................................................................................................................................................................................................

Exploration and Production 1 000 138 306 1 938 78 .......................................................................................................................................................................................................................................................

Refining and Marketing 2 022 2 137 1 726 819 407 .......................................................................................................................................................................................................................................................

Corporate, Energy Trading and Eliminations (1 151) (3) (331) (448) 104

3 911 2 740 4 304 3 829 1 146
Operating earnings
.......................................................................................................................................................................................................................................................
Oil Sands 2098 2025 2737 1379 1048
.......................................................................................................................................................................................................................................................
Exploration and Production 1 210 850 1 358 1 193 150
.......................................................................................................................................................................................................................................................
Refining and Marketing 2 022 2 152 1 726 796 455
.......................................................................................................................................................................................................................................................
Corporate, Energy Trading and Eliminations (630) (180) (147) (734) (538)

4 700 4 847 5 674 2 634 1 115

Cash flow from (used in) operations
.......................................................................................................................................................................................................................................................
Oil Sands 4556 4407 4572 2777 1251
.......................................................................................................................................................................................................................................................
Exploration and Production 2 316 2 227 2 846 3 325 1 280
.......................................................................................................................................................................................................................................................
Refining and Marketing 2 618 3 138 2 574 1 538 921
.......................................................................................................................................................................................................................................................
Corporate, Energy Trading and Eliminations (78) (39) (246) (984) (653)

9 412 9 733 9 746 6 656 2 799

Capital and exploration expenditures (including
capitalized interest)
.......................................................................................................................................................................................................................................................
Oil Sands 4311 4957 5100 3709 2831
.......................................................................................................................................................................................................................................................
Exploration and Production 1 483 1 261 874 1 274 986
.......................................................................................................................................................................................................................................................
Refining and Marketing 890 644 633 667 380
.......................................................................................................................................................................................................................................................
Corporate, Energy Trading and Eliminations 93 95 243 360 70

6 777 6 957 6 850 6 010 4 267

Total assets 78 315
76 401
74 777 68 607 69 746

Ending capital employed
.......................................................................................................................................................................................................................................................
Short-term and long-term debt, less cash and cash
equivalents 6 256 6 639 6 976 11 254 13 377
.......................................................................................................................................................................................................................................................
Shareholders’ equity 41 180 39 215 38 600 35 192 34 111

47 436 45 854 45 576 46 446 47 488
.......................................................................................................................................................................................................................................................
Less average capitalized costs related to major
projects in progress
(6 502) (8 729) (12 106) (12 890) (10 655)

40 934 37 125 33 470 33 556 36 833

Total Suncor employees (number at year end) 13 946
13 932
13 026
12 076
12 978


Footnotes, see page 143.


SUNCOR ENERGY INC. ANNUAL REPORT 2013 141