Page 147 - Suncor AR English
P. 147
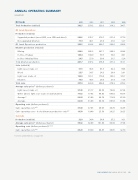
ANNUAL OPERATING SUMMARY

(unaudited)


Oil Sands 2013 2012 2011 2010 2009

Total Production (mbbls/d) 392.5 359.2 339.3 318.2 306.7


Oil Sands Operations
.......................................................................................................................................................................................................................................................
Production (mbbls/d)
.......................................................................................................................................................................................................................................................
Upgraded product (sweet SCO, sour SCO and diesel) 282.6 276.7 279.7 251.4 277.9
.......................................................................................................................................................................................................................................................
Non-upgraded bitumen 77.9 48.1 25.0 31.6 12.7

Oil Sands Operations production 360.5 324.8 304.7 283.0 290.6

Bitumen production (mbbls/d) .......................................................................................................................................................................................................................................................

Mining 269.8 266.2 287.1 266.2 289.6 .......................................................................................................................................................................................................................................................

In Situ – Firebag 143.4 104.0 59.5 53.6 49.1 .......................................................................................................................................................................................................................................................

In Situ – MacKay River 28.5 27.0 30.0 31.5 12.4
Total bitumen production 441.7 397.2 376.6 351.3 351.1

Sales (mbbls/d)
.......................................................................................................................................................................................................................................................
Light sweet crude oil 91.5 93.8 85.5 82.3 99.6
.......................................................................................................................................................................................................................................................
Diesel 23.5 24.5 24.3 20.4 29.1
.......................................................................................................................................................................................................................................................
Light sour crude oil 166.0 161.1 170.6 145.2 135.7
.......................................................................................................................................................................................................................................................
Bitumen 76.0 44.5 24.0 31.4 11.8

Total sales 357.0 323.9 304.4 279.3 276.2

Average sales price(1) (dollars per barrel)
.......................................................................................................................................................................................................................................................
Light sweet crude oil 97.98 91.17 98.50 79.03 67.26
.......................................................................................................................................................................................................................................................
Other (diesel, light sour crude oil and bitumen) 77.62 77.83 84.93 68.63 64.18
.......................................................................................................................................................................................................................................................
Average* 82.83 81.69 88.74 71.69 65.29
.......................................................................................................................................................................................................................................................
Average 82.83 81.69 88.74 69.58 61.66

Operating costs (dollars per barrel)
.......................................................................................................................................................................................................................................................
Cash operating costs*(2) 37.00 37.05 39.05 36.70 33.95
.......................................................................................................................................................................................................................................................
Cash operating costs – In situ bitumen production only*(2) 16.50 19.40 25.50 20.25 20.25
.......................................................................................................................................................................................................................................................
Syncrude
.......................................................................................................................................................................................................................................................
Production (mbbls/d) 32.0 34.4 34.6 35.2 16.1

Average sales price(1) (dollars per barrel) 99.82 92.69 101.80 80.93 77.36

Operating costs (dollars per barrel)****
.......................................................................................................................................................................................................................................................
Cash operating costs*(2) 43.20 39.30 40.45 36.05 32.50


Footnotes and definitions, see page 147.


SUNCOR ENERGY INC. ANNUAL REPORT 2013 143