Page 148 - Suncor AR English
P. 148
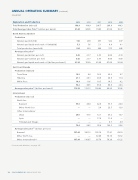
ANNUAL OPERATING SUMMARY (continued)

(unaudited)


Exploration and Production 2013 2012 2011 2010 2009

Total Production (mboe/d) 169.9 189.9 206.7 296.9 149.3
.......................................................................................................................................................................................................................................................
Total Average Sales Price(1) (dollars per barrel) 91.44 84.05 79.95 61.06 76.77


North America Onshore
.......................................................................................................................................................................................................................................................
Production
.......................................................................................................................................................................................................................................................
Natural gas (mmcf/d) 192 290 357 522 397
.......................................................................................................................................................................................................................................................
Natural gas liquids and crude oil (mbbls/d) 5.3 5.6 5.1 8.8 8.1
.......................................................................................................................................................................................................................................................
Total production (mmcfe/d) 224 323 388 575 446

Average sales price(1)
.......................................................................................................................................................................................................................................................

Natural gas (dollars per mcf) 3.42 2.17 3.55 4.04 4.10 .......................................................................................................................................................................................................................................................

Natural gas* (dollars per mcf) 3.42 2.17 3.55 4.04 4.08 .......................................................................................................................................................................................................................................................

Natural gas liquids and crude oil (dollars per barrel) 81.34 76.93 85.30 67.06 56.84

East Coast Canada
.......................................................................................................................................................................................................................................................
Production (mbbls/d)
.......................................................................................................................................................................................................................................................
Terra Nova 14.2 8.8 16.2 23.2 8.7
.......................................................................................................................................................................................................................................................
Hibernia 27.1 26.1 30.9 30.9 11.4
.......................................................................................................................................................................................................................................................
White Rose 14.9 11.6 18.5 14.5 4.2

56.2 46.5 65.6 68.6 24.3

Average sales price(1) (dollars per barrel) 112.39 112.15 108.42 80.20 76.86


International
.......................................................................................................................................................................................................................................................
Production (mboe/d)
.......................................................................................................................................................................................................................................................
North Sea
.......................................................................................................................................................................................................................................................
Buzzard 55.8 48.0 42.9 55.5 20.0
.......................................................................................................................................................................................................................................................
Other North Sea — — 3.8 23.5 12.0
.......................................................................................................................................................................................................................................................
Other International
.......................................................................................................................................................................................................................................................
Libya 20.6 41.5 12.1 35.2 13.7
.......................................................................................................................................................................................................................................................
Syria — — 17.6 11.6 —
.......................................................................................................................................................................................................................................................
Trinidad and Tobago — — — 6.7 4.9

76.4 89.5 76.4 132.5 50.6
Average sales price(1) (dollars per boe)
.......................................................................................................................................................................................................................................................
Buzzard 107.44 106.12 105.18 77.91 69.53
.......................................................................................................................................................................................................................................................
Other North Sea — — 92.49 78.16 73.52
.......................................................................................................................................................................................................................................................
Other International** 107.94 110.65 95.76 70.39 61.25


Footnotes and definitions, see page 147.


144 SUNCOR ENERGY INC. ANNUAL REPORT 2013