Page 149 - Suncor AR English
P. 149
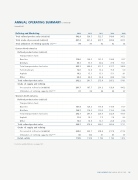
ANNUAL OPERATING SUMMARY
(continued)

(unaudited)


Refining and Marketing
2013 2012 2011 2010 2009
Total refined product sales (mbbls/d) 542.9 538.5 522.7 549.0 345.2
.......................................................................................................................................................................................................................................................
Total crude oil processed (mbbls/d) 431.3 431.4 407.7 409.6 397.5
.......................................................................................................................................................................................................................................................
Total utilization of refining capacity (%)*** 94 95 92 92 92


Eastern North America
.......................................................................................................................................................................................................................................................
Refined product sales (mbbls/d)
.......................................................................................................................................................................................................................................................
Transportation fuels
.......................................................................................................................................................................................................................................................
Gasoline 116.0 124.5 131.5 139.8 91.7
.......................................................................................................................................................................................................................................................
Distillate 89.1 75.5 80.2 77.9 55.1

Total transportation fuel sales 205.1 200.0 211.7 217.7 146.8
.......................................................................................................................................................................................................................................................
Petrochemicals 12.6 12.6 13.2 15.8 5.0
.......................................................................................................................................................................................................................................................
Asphalt 16.2 15.1 15.1 17.1 9.1
.......................................................................................................................................................................................................................................................
Other 28.3 34.0 33.6 34.6 13.2

Total refined product sales 262.2 261.7 273.6 285.2 174.1

Crude oil supply and refining
.......................................................................................................................................................................................................................................................

Processed at refineries (mbbls/d) 201.7 197.7 201.3 192.0 186.2 .......................................................................................................................................................................................................................................................

Utilization of refining capacity (%)*** 91 89 94 89 87

Western North America
.......................................................................................................................................................................................................................................................
Refined product sales (mbbls/d)
.......................................................................................................................................................................................................................................................
Transportation fuels
.......................................................................................................................................................................................................................................................
Gasoline 131.4 128.3 118.0 118.8 81.7
.......................................................................................................................................................................................................................................................
Distillate 120.7 119.5 110.5 113.2 59.8

Total transportation fuel sales 252.1 247.8 228.5 232.0 141.5
.......................................................................................................................................................................................................................................................
Asphalt 11.8 10.1 7.5 7.9 8.2
.......................................................................................................................................................................................................................................................
Other 16.8 18.9 13.1 23.9 21.4

Total refined product sales 280.7 276.8 249.1 263.8 171.1

Crude oil supply and refining
.......................................................................................................................................................................................................................................................
Processed at refineries (mbbls/d) 229.6 233.7 206.4 217.6 211.3
.......................................................................................................................................................................................................................................................
Utilization of refining capacity (%)*** 96 100 91 95 97

Retail outlets 1 505 1 509 1 732 1 723 1 813


Footnotes and definitions, see page 147.


SUNCOR ENERGY INC. ANNUAL REPORT 2013 145