Page 28 - MIC 2014 - English
P. 28
EXECUTIVE COMPENSATION
COMPENSATION DISCUSSION AND ANALYSIS
2013 Named Executive Officers
The persons (the ‘‘NEOs’’ or ‘‘Named Executive Officers’’) who are the focus of the Compensation Discussion and Analysis
and who appear in the compensation tables are:
STEVEN W. WILLIAMS S.W. WILLIAMS PRESIDENT AND CHIEF EXECUTIVE OFFICER
.......................................................................................................................................................................................................................................................
STEPHEN D.L. REYNISH S.D.L. REYNISH EXECUTIVE VICE PRESIDENT, STRATEGY & CORPORATE DEVELOPMENT AND
INTERIM CHIEF FINANCIAL OFFICER(1)
.......................................................................................................................................................................................................................................................
BART W. DEMOSKY B.W. DEMOSKY FORMER CHIEF FINANCIAL OFFICER(2)
.......................................................................................................................................................................................................................................................
MARK S. LITTLE M.S. LITTLE EXECUTIVE VICE PRESIDENT, UPSTREAM(3)
.......................................................................................................................................................................................................................................................
MICHAEL R. MACSWEEN M.R. MACSWEEN EXECUTIVE VICE PRESIDENT, MAJOR PROJECTS
.......................................................................................................................................................................................................................................................
BORIS J. JACKMAN B.J. JACKMAN FORMER EXECUTIVE VICE PRESIDENT, REFINING AND MARKETING(4)
(1) Mr. Reynish was Executive Vice President, Oil Sands Ventures in 2013 and was appointed Interim Chief Financial Officer on December 9, 2013.
Effective January 1, 2014, Mr. Reynish became Executive Vice President, Strategy & Corporate Development and remains Interim Chief Financial Officer.
Mr. Reynish received no additional compensation for acting in the capacity of Interim Chief Financial Officer in 2013.
(2) Mr. Demosky was Chief Financial Officer until December 9, 2013, and resigned from Suncor effective December 27, 2013.
(3) Effective January 1, 2014, Mr. Little was appointed to Executive Vice President, Upstream. In 2013, he was Executive Vice President, Oil Sands and
In Situ.
(4) Mr. Jackman was Executive Vice President, Refining and Marketing until September 9, 2013, and retired from Suncor effective September 30, 2013.
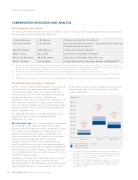
Pay and Performance at Suncor – Overview
Suncor’s executive compensation programs are designed to below shows Suncor’s ranking as compared to the Suncor
reward executives for delivering results and building Compensation Peers in terms of revenues, assets and
sustainable shareholder value. Our programs align the market capitalization.
interests of our executives with shareholders by tying pay
outcomes to our short-, medium-, and long-term ($millions)
performance. Our business is linked to the commodity cycle
with significant and long-term capital needs, and requires 90,000
focus on profitable growth that is achieved through reliable Suncor
80,000 88th Percentile
operations conducted in a safe and environmentally and
socially responsible way.
70,000
Suncor
The following information is intended to provide a quick 60,000 88th Percentile
overview of some key points regarding pay and 50,000
performance at Suncor.
40,000
Our Size and Scope. Our senior executives are responsible Suncor
88th Percentile
for managing a large, global enterprise with multiple 30,000
operating units and significant capital expenditures. Suncor
20,000
is the largest energy company in Canada and the fifth
largest in North America by market capitalization. Our 10,000
capital expenditures of over $6 billion per year are larger 0
than the market capitalization of most Canadian RevenueAssetsMarket Cap.
(1)
(1)
(2)
companies. Because of our scale and complexity, our
market for skilled executives must consider organizations Suncor
Market 75th Percentile
Market 50th Percentile
outside of Canada and therefore we look to a broad North Market 25th Percentile
American group of energy companies, which comprise the 18FEB201418201683
Suncor Compensation Peers (as set out on page 35 of this (1) Percentile rank for Revenue and Assets is based on information
reported for the nine months ended September 30, 2013. Where
management proxy circular).
applicable, values are converted to Canadian dollars based on the
Although we are larger than most of our peers, we target exchange rate on September 30, 2013.
pay at the median of the group and measure total (2) Percentile rank for Market Capitalization is based on information
reported as of December 31, 2013. Where applicable, values are
shareholder return (‘‘TSR’’) performance relative to a similar converted to Canadian dollars based on the exchange rate on
group of North American energy companies. The chart
December 31, 2013.
26 SUNCOR ENERGY INC. MANAGEMENT PROXY CIRCULAR 2014