Page 26 - MIC 2014 - English
P. 26
EXECUTIVE COMPENSATION
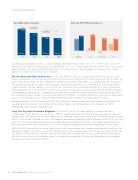
Recordable injury frequency
2012 and 2013 TSR performance (%)
0.88 0.89
0.85
0.77 CAPP
0.73
17.5
0.59
16.3
0.56
13.6
13.1
13.0
7.2
1.0
Suncor
-0.6
Suncor
Suncor
Suncor
2010
2011
2012 2013 25FEB201419160015
Suncor
Peers
TSX Energy TSX
11FEB201402595571
Our focus on operational excellence and on improving shareholder return resulted in a 13.1% TSR in 2012 and 16.3%
TSR in 2013. In addition, Suncor increased its dividend by 18% in the second quarter of 2012 and by 54% in the second
quarter of 2013. Our two-year TSR was better than 70% of the issuers in our peer group. In February 2014, Suncor
announced a further 15% increase to its dividend.
2013 President and CEO Pay Outcomes. In 2013, Mr. Williams’ total direct compensation (which includes his actual
salary + actual bonus + the grant date fair value of his annual mid- to long-term incentive awards) was $12.9 million, up
26.5% from $10.2 million for 2012 following his appointment to CEO in May 2012. It is important to note that part of
this increase was due to the move in 2013 to begin valuing equity awards on an accounting basis (e.g., using a Black
Scholes valuation for stock options in line with Suncor’s financials) versus a binomial valuation basis used in prior years.
More information on the impact of the change to an accounting valuation of equity awards from the binomial valuation
methodology used prior to 2013 is provided in the notes to the summary compensation table beginning on page 58 of
our management proxy circular. The increase also reflects Mr. Williams’ exceptional performance rating by the Board and a
full year at the annual incentive target level for President and CEO as compared to eight months in 2012.
Approximately 90% of the President and CEO’s 2013 total direct compensation varied with performance and over 70%
was provided in the form of mid- to long-term incentives, tying a substantial portion of the President and CEO’s
compensation to increasing shareholder value.
Long Term Pay and Performance Alignment. Over the 2011 to 2013 period, aggregate realizable total direct
compensation of our Named Executive Officers (‘‘NEOs’’), identified on page 26 of our management proxy circular, was
approximately 20% lower than the value reported in the summary compensation table in our management proxy circulars
over the same period. Although we have seen improved operational performance and shareholder returns in the past two
years, the 2011 annual PSU award generated a payout lower than target and the 2011 stock option award held by the
NEOs has yet to deliver value, reflecting the pay and performance alignment in our mid- to long-term incentive plans.
While the NEOs have realized increasing short-term incentive compensation from improving operational performance, the
aggregate realizable value of the annual mid- to long-term incentive compensation is 29% below the expected value for
the 2011 to 2013 period. The realizable value of the annual mid- and long-term incentive compensation is generally in
line with Suncor’s share price performance over this period and demonstrates Suncor’s pay-for-performance philosophy
and alignment with shareholder interests.
24 SUNCOR ENERGY INC. MANAGEMENT PROXY CIRCULAR 2014