Page 24 - MIC 2014 - English
P. 24
BOARD OF DIRECTORS COMPENSATION
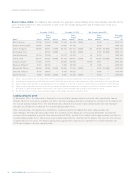
Director Value at Risk. The following table provides the aggregate equity holdings of our non-employee directors for the
years ended December 31, 2012 and 2013 as well as the net change during 2013 and the total value at risk as at
December 31, 2013.
December 31, 2012
December 31, 2013
Net Change During 2013
Share- Share- Share- Total value
based based based
at risk(3)(4)(5)
Name (1)
Shares awards (2)
Options
Shares
awards (2)
Options
Shares
awards (2) Options
($)
16000
17548
63419
16000
—
3015211
Mel E. Benson
17548 55319
8100 —
.......................................................................................................................................................................................................................................................
Dominic D’Alessandro 10 000 31 886 — 10 000 41 185 — — 9 299 — 1 906 129
.......................................................................................................................................................................................................................................................
John T. Ferguson 59908 92631 52000 60141 107101 36000 233 14470 (16000) 6508172
.......................................................................................................................................................................................................................................................
W. Douglas Ford — 66523 40000 — 76320 24000 — 9797 (16000) 2956717
.......................................................................................................................................................................................................................................................
Paul Haseldonckx 12 154 27 204 — 12 217 33 383 — 63 6 179 — 1 698 144
.......................................................................................................................................................................................................................................................
John R. Huff 43107 90293 48000 43174 100601 32000 67 10308 (16000) 5634261
.......................................................................................................................................................................................................................................................
Jacques Lamarre 11 280 31 535 — 28 000 40 586 — 16 720 9 051 — 2 554 143
.......................................................................................................................................................................................................................................................
Maureen McCaw(5) 5 211 40 742 — 5 306 48 590 — 95 7 848 — 2 007 087
.......................................................................................................................................................................................................................................................
Michael W. O’Brien 26808 50863 36000 26808 57563 24000 — 6700 (12000) 3256536
.......................................................................................................................................................................................................................................................
James W. Simpson 4736 36637 — 4736 43023 — — 6386 — 1778545
.......................................................................................................................................................................................................................................................
Eira M. Thomas 4000 45803 24000 4000 52392 24000 — 6589 — 2100038
(1) Messrs. Gass and Wilson are not represented in the foregoing table as they were appointed to the Board effective February 3, 2014.
(2) Includes DSUs issued under the DSU Plan and closed PCCDSU Plan and in the case of Mr. Haseldonckx, RSUs issued under the closed PCRSU Plan.
(3) Value of shares, DSUs and RSUs is calculated based on the closing price on the TSX of a Suncor common share on December 31, 2013 ($37.24).
(4) Value of options reported reflects the ‘in-the-money’ amount (the difference between the closing price on the TSX of a Suncor common share on
December 31, 2013 ($37.24) and the exercise price of the option) of the exercisable options held as at December 31, 2013.
(5) Ms. McCaw’s Suncor common shares and values based on that number have been restated for 2012.
Looking Ahead to 2014:
In November 2013, the Governance Committee reviewed total compensation benchmark data provided by Towers
Watson for 2012, and where available, for 2013, for non-employee directors, including the chairman of the Board, for
the Suncor Compensation Peers. The benchmark data showed that Suncor’s total compensation for non-employee
directors was below the median of the Suncor Compensation Peers.
After consideration, the Governance Committee recommended to the Board that total compensation for
non-employee directors for 2014, other than the chairman of the Board, be increased to $300,000, and that the
increase will be provided as part of their annual grant of DSUs, to reflect the median total compensation level for the
Suncor Compensation Peers. No increase was recommended for the chairman of the Board. This was the first increase
recommended in five years. The Board subsequently approved the Governance Committee’s recommendations for
2014 non-employee director compensation.
22 SUNCOR ENERGY INC. MANAGEMENT PROXY CIRCULAR 2014