Page 30 - MIC 2014 - English
P. 30
EXECUTIVE COMPENSATION
In reviewing the alignment of our pay programs relative to performance we look at two different pay perspectives: Pay
Opportunity and Realizable Pay.
Pay Opportunity
Realizable Pay
Static numbers reported in the Summary Compensation Dynamic number that captures the current value of
Table for 2011 and 2012 and estimated pay for 2013.
outstanding equity awards.
Includes salary, annual incentive award and the Includes salary, annual incentive award and the current
estimated grant date values of PSUs and stock option accrued value of outstanding stock options and PSUs.
awards.
The values ultimately received could be quite different
Does not reflect the impact of share price on the depending on future performance.
ultimate value received through equity awards
(including the vesting level which can be from 0% to
200%).
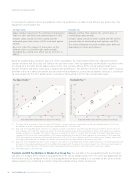
Based on available public disclosure data and certain assumptions, the charts below indicate the alignment between
Suncor’s President and CEO’s pay and TSR over the past three-years(1) for Pay Opportunity and Realizable Pay (which terms
are described in the table directly above) relative to the chief executive officers of the Suncor Compensation Peers.
Suncor’s President and CEO’s realized pay is aligned with performance. The difference between the values under each pay
definition is due to a significant amount of pay being tied to performance, particularly to absolute share price, resulting in
no value to date for the 2011 option grants, and relative TSR resulting in 2011 PSUs vesting below target.
Pay Opportunity(1)(2) Realizable Pay(1)(3)
100
100
p
p
ouou
GrGr
er er
75
75
PePe
of of
le e
ntintil
50
50
rcece
Suncor
PePer
ty ay
Suncor
uni P
25
25
ortble
ppza
Oeali
ay R
00
O PEO
EC
0 25 50 75 100 0 25 50 75 100
C
(4) (4)
Total Shareholder Return (TSR)Percentile of Peer Group Total Shareholder Return (TSR)Percentile of Peer Group 14FEB201402161607 14FEB201402162144
(1) The charts reflect an average of Suncor’s former CEO, Richard L. George’s total direct compensation for the year ended December 31, 2011 and
Mr. Williams’ total direct compensation for the years ended December 31, 2012 and 2013.
(2) Data used for the Pay Opportunity chart for peer companies is based on information extracted from public disclosure filed from 2011 to 2013. For
peer companies, 2011 and 2012 amounts are actuals. The 2013 pay opportunity amounts are determined as follows: 2013 salaries are used where
available, and where not available, 2012 salaries have been increased by 4% which is consistent with the median from market survey data for peer
companies; 2013 bonuses are estimated based on 2013 salaries multiplied by the actual 2012 bonus payment as a percentage of 2012 salary; and
2013 equity awards are actual amounts from public disclosure for 16 of the 17 peer companies, and for the remaining peer company, where actual
2013 equity award data was not available, an estimate was used based on the equity award for the previous three years.
(3) Data used for the Realizable Pay chart for peer companies is the same as for Pay Opportunity for base salaries and bonuses; the equity award amounts
are based on the equity award data used in the Pay Opportunity analysis with the values for the options equal to the ‘in-the-money’ value based on
December 31, 2013 share prices. PSU amounts assume target payouts and a December 31, 2013 share price for each peer company.
(4) TSR ranking based on three-year TSR.
President and CEO Pay Multiple of Median Peer Group Pay. We also look at the pay opportunity for the President
and CEO as a multiple of the median pay opportunity of the Suncor Compensation Peers. The 2013 pay opportunity for
the President and CEO compared to the 2012 pay opportunity for our peer group is at a multiple of one of the Suncor
Compensation Peers, reinforcing the market competitive position of pay relative to our peers.
28 SUNCOR ENERGY INC. MANAGEMENT PROXY CIRCULAR 2014