Page 31 - MIC 2014 - English
P. 31
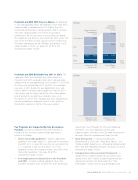
President and CEO 2013 Pay at a Glance. As displayed
($‘000s)
in the corresponding chart, Mr. Williams’ 2013 total direct Total Direct
compensation is approximately 15% higher than the
Compensation
benchmarked total direct compensation (‘‘TDC’’) structure. Target Total Direct 12,852
The 2013 compensation level reflects his personal Compensation
11,165
4,454
performance for the past year as assessed by the Board,
the corporate and business unit results for 2013 and a full Stock options
3,850

year at the President & CEO annual incentive target level.
For more information on Mr. Williams’ performance and
4,687
At risk
compensation in 2013, see pages 41 to 45 in this PSUs
Comp.
3,850
management proxy circular.


Bonus Target 1,925
Actual 2,420


Salary
Fixed 1,540
1,291
Comp.
President & CEO Steve Williams
pay structure
2013
27FEB201402060924


President and CEO Realizable Pay 2011 to 2013. The
($‘000s)
aggregate three-year realizable pay chart shows the
President and CEO’s realizable total direct compensation
Total Direct
compared to his pay opportunity at December 31, 2013 for Compensation
the three-year period from 2011 to 2013. The realizable 29,590
Total Direct
pay value is 20% below the pay opportunity level and Compensation
reflects both the below target payout level for the 2011
23,632
PSU award, and that only two of the three stock option
grants during the period have realizable value as at

December 31, 2013. The realizable pay level demonstrates
pay for performance alignment and is in line with the

shareholder experience for the three-year period.


Aggregate 3 Year Aggregate 3 Year

Pay Opportunity
Realizable Pay
27FEB201402061153


Pay Programs Are Supported By Key Governance requirement level through the first year following
Practices. Suncor has implemented and maintains a retirement. See ‘‘Our Approach to Executive

number of key executive compensation governance Compensation – President and CEO Hold Requirement’’
practices including:
on page 36 of this management proxy circular.

• Share ownership guidelines – market competitive • Claw back policy – a claw back policy was

guidelines that range from 5  salary for the President implemented in 2012 (the ‘‘Claw Back Policy’’). See
and CEO to 3  salary for executive vice presidents to ‘‘Compensation Governance – Managing Compensation

2 salary for senior vice presidents. See ‘‘Our Risk – Key Risk Mitigating Features’’ on page 33 of this
Approach to Executive Compensation – Executive Share management proxy circular.
Ownership Guidelines’’ on page 36 of this
• Compensation risk assessment framework – a
management proxy circular.
comprehensive compensation risk assessment was

• Post-employment hold periods for the President conducted in 2011, which included implementing a
and CEO – a market leading approach where the detailed 22-element risk framework (the ‘‘Risk

President and CEO must maintain his share ownership
Framework’’), which assesses pay philosophy and


SUNCOR ENERGY INC. MANAGEMENT PROXY CIRCULAR 2014 29