Page 54 - Suncor AR English
P. 54
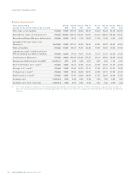
QUARTERLY FINANCIAL DATA


Business Environment

Three months ended
Dec 31 Sept 30 June 30 Mar 31 Dec 31 Sept 30 June 30 Mar 31

(average for the period ended, except as noted)
2013 2013
2013
2013
2012
2012
2012 2012
97.45 105.85 94.20
WTI crude oil at Cushing
US$/bbl
94.35
88.20
92.20
93.50 102.95
.......................................................................................................................................................................................................................................................
Dated Brent crude oil at Sullom Voe US$/bbl 109.35 109.70 103.35 112.65 110.10 109.50 108.90 118.35
.......................................................................................................................................................................................................................................................
Dated Brent/Maya FOB price differential US$/bbl 20.05 10.35 5.50 10.60 17.30 11.90 9.85 9.45
.......................................................................................................................................................................................................................................................
Canadian 0.3% par crude oil at

Edmonton Cdn$/bbl 89.05 105.25 92.90 88.45 84.35 84.70 84.45 92.80
.......................................................................................................................................................................................................................................................

WCS at Hardisty US$/bbl 65.25 88.35 75.05 62.40 70.05 70.45 70.60 81.50 .......................................................................................................................................................................................................................................................

Light/heavy crude oil differential for
WTI at Cushing less WCS at Hardisty US$/bbl 32.20 17.50 19.15 31.95 18.15 21.75 22.90 21.45
.......................................................................................................................................................................................................................................................
Condensate at Edmonton US$/bbl 94.20 103.80 103.30 107.20 98.10 96.00 99.40 110.00
.......................................................................................................................................................................................................................................................
Natural gas (Alberta spot) at AECO Cdn$/mcf 3.15 2.80 3.60 3.05 3.05 2.20 1.85 2.50
.......................................................................................................................................................................................................................................................
New York Harbor 3-2-1 crack(1) US$/bbl 19.60 19.25 25.60 31.20 35.95 37.80 31.95 25.80
.......................................................................................................................................................................................................................................................
Chicago 3-2-1 crack(1) US$/bbl 12.00 15.80 30.70 27.10 27.85 35.15 27.85 18.80
.......................................................................................................................................................................................................................................................
Portland 3-2-1 crack(1) US$/bbl 15.35 19.60 30.60 30.55 29.85 38.15 37.90 27.70
.......................................................................................................................................................................................................................................................
Gulf Coast 3-2-1 crack(1) US$/bbl 13.45 15.95 24.00 28.80 27.35 33.95 29.30 25.45
.......................................................................................................................................................................................................................................................
Exchange rate US$/Cdn$ 0.95 0.96 0.98 0.99 1.00 1.00 0.99 1.00
.......................................................................................................................................................................................................................................................
Exchange rate (end of period) US$/Cdn$ 0.94 0.97 0.95 0.98 1.01 1.02 0.98 1.00

(1) 3-2-1 crack spreads are indicators of the refining margin generated by converting three barrels of WTI into two barrels of gasoline and one barrel of
diesel. The crack spreads presented here generally approximate the regions into which the company sells refined products through retail and wholesale

channels.


50 SUNCOR ENERGY INC. ANNUAL REPORT 2013