Page 52 - Suncor AR English
P. 52
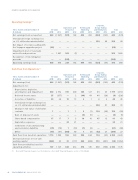
FOURTH QUARTER 2013 ANALYSIS


Operating Earnings(1)

Corporate,

Exploration and Refining and Energy Trading
Three months ended December 31
Oil Sands Production
Marketing
and Eliminations
Total
($ millions)
2013 2012
2013 2012
2013 2012
2013 2012 2013 2012

469 (1 037) .......................................................................................................................................................................................................................................................
(101) 148
Net earnings (loss) as reported
443 (574)
458 450
(383) (135)

Unrealized foreign exchange loss
on U.S. dollar denominated debt — — — — — — 259 80 259 80
.......................................................................................................................................................................................................................................................
Net impact of not proceeding with
the Voyageur upgrader project (69) — — — — — — — (69) —
.......................................................................................................................................................................................................................................................
Impairments (net of reversals),

write-offs and provisions — 1 487 563 (5) — — — — 563 1 482
.......................................................................................................................................................................................................................................................

Recognition of risk mitigation
proceeds
— — (223) —
— — — — (223) —

Operating earnings (loss)
400
450
239 143
458 450 (124) (55)
973 988


Cash Flow from Operations(1)

Corporate,

Exploration and Refining and Energy Trading
Three months ended December 31
Production
Total
Oil Sands Marketing
and Eliminations
($ millions)
2013 2012
2013 2012
2013 2012 2013 2012 2013 2012

469 (1 037) Net earnings (loss)
(101) 148
458 450
(383) (135)
443 (574)
.......................................................................................................................................................................................................................................................
Adjustments for:
.......................................................................................................................................................................................................................................................
Depreciation, depletion,
amortization and impairment 680 2 552 915 300 149 127 31 35 1 775 3 014
.......................................................................................................................................................................................................................................................
Deferred income taxes 35 (357) — 2 (84) 68 41 (39) (8) (326)
.......................................................................................................................................................................................................................................................
Accretion of liabilities 30 26 10 15 2 1 2 3 44 45
.......................................................................................................................................................................................................................................................
Unrealized foreign exchange loss
on U.S. dollar denominated debt — — — — — — 304 91 304 91
.......................................................................................................................................................................................................................................................
Change in fair value of derivative

contracts 1 — 1 1 2 (1) 154 (20) 158 (20)
.......................................................................................................................................................................................................................................................
Gain on disposal of assets — — — — (3) (5) — — (3) (5)
.......................................................................................................................................................................................................................................................
Share-based compensation 17 17 7 3 10 10 47 13 81 43
.......................................................................................................................................................................................................................................................
Exploration expenses — — 23 21 — — — — 23 21
.......................................................................................................................................................................................................................................................
Settlement of decommissioning
and restoration liabilities (75) (70) 1 (10) (7) (8) — — (81) (88)
.......................................................................................................................................................................................................................................................
Other (47) (41) (304) 49 7 (8) (42) 27 (386) 27

Cash flow from (used in) operations 1 110 1 090 552 529 534 634 154 (25) 2 350 2 228
.......................................................................................................................................................................................................................................................
(Increase) decrease in non-cash
working capital (963) 35 91 (117) 340 (489) 518
(481) (14) (1 052)

Cash flow provided by (used in)

operating activities 147 1 125 643 412 874 145 672
(506)
2 336 1 176

(1) Non-GAAP financial measure. See the Advisories – Non-GAAP Financial Measures section of this MD&A.


48 SUNCOR ENERGY INC. ANNUAL REPORT 2013