Page 50 - Suncor AR English
P. 50
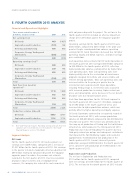
FOURTH QUARTER 2013 ANALYSIS


5. FOURTH QUARTER 2013 ANALYSIS


Financial and Operational Highlights

Three months ended December 31 with not proceeding with the project. The net loss in the
($ millions, except as noted)
fourth quarter of 2012 included an after-tax impairment 2013 2012

charge of $1.487 billion against the Voyageur upgrader Net earnings (loss)
project.
........................................................................................................................
Oil Sands 469 (1 037)
Operating earnings for the fourth quarter of 2013 were ........................................................................................................................
Exploration and Production (101) 148
$400 million, compared to $450 million in the prior year ........................................................................................................................
quarter. Despite record production volumes, operating Refining and Marketing 458 450
........................................................................................................................
earnings for Oil Sands Operations decreased due to higher Corporate, Energy Trading and
operating, royalty and DD&A expenses, and lower average Eliminations
(383) (135)

price realizations.
Total
443 (574)

Cash operating costs per barrel for Oil Sands Operations in Operating earnings (loss)(1)
the fourth quarter of 2013 averaged $36.85/bbl compared ........................................................................................................................
Oil Sands 400 450
to $38.00/bbl in the fourth quarter of 2012, reflecting ........................................................................................................................
higher production volumes, partially offset by higher total Exploration and Production 239 143
........................................................................................................................
cash operating costs. Total cash operating costs were Refining and Marketing 458 450
higher partially due to the acceleration of maintenance ........................................................................................................................
Corporate, Energy Trading and
programs designed to facilitate and ensure reliable and
efficient mining operations. Total cash operating costs also Eliminations
(124) (55)
Total
973 988
increased relative to the prior year quarter due to
incremental costs associated with larger operations, Cash flow from (used in)

including Firebag Stage 4, incremental costs associated operations(1)
........................................................................................................................
with increased production in mining, higher natural gas
Oil Sands 1 110 1 090 ........................................................................................................................
prices and consumption, and a decrease in the net benefit
of power sales due to lower power prices.
Exploration and Production 552 529 ........................................................................................................................

Cash flow from operations for the Oil Sands segment in Refining and Marketing 534 634 ........................................................................................................................

the fourth quarter of 2013 was $1.110 billion, compared Corporate, Energy Trading and
to $1.090 billion in the fourth quarter of 2012, and Eliminations
154 (25)

increased due to higher production volumes, which was Total
2 350
2 228
partially offset by higher operating and royalty expenses.
Production volumes (mboe/d)
Oil Sands Operations continued to set quarterly records in ........................................................................................................................
Oil Sands 446.5 378.7
the fourth quarter of 2013, with average production ........................................................................................................................
volumes of 409,600 bbls/d, compared to 342,800 bbls/d in Exploration and Production 111.6 177.8

the prior year quarter. The increase was primarily due to Total 558.1 556.5
the ramp up of production at Firebag and the hot bitumen
(1) Non-GAAP financial measures. Operating earnings and cash flow from
infrastructure commissioned in the third quarter of 2013. operations are reconciled below. See the Advisories – Non-GAAP
Production was reduced throughout the quarter due to a Financial Measures section of this MD&A.
third-party natural gas outage and subsequent curtailments

that impacted the Fort McMurray region and resulted in Segment Analysis
approximately 15,000 bbls/d of lost production in the
Oil Sands
fourth quarter of 2013. Suncor’s share of Syncrude
production averaged 36,900 bbls/d in the fourth quarter of For the fourth quarter of 2013, Oil Sands segment net
earnings were $469 million, compared with a net loss of
2013, consistent with production of 35,900 bbls/d in the
fourth quarter of 2012.
$1.037 billion for the fourth quarter of 2012. Net earnings
in the quarter included a favourable after-tax adjustment of

Exploration and Production
$69 million relating to not proceeding with the Voyageur
upgrader project to reduce the previous cost estimate
The net loss in Exploration and Production was
$101 million for the fourth quarter of 2013, compared recorded in the first quarter of 2013. Due to acceleration
of project closure activities and a redeployment of
with net earnings of $148 million for the fourth quarter of
2012. The net loss for the fourth quarter of 2013 includes
resources, the company has reduced the costs associated


46 SUNCOR ENERGY INC. ANNUAL REPORT 2013