Page 49 - Suncor AR English
P. 49
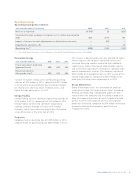
Operating Earnings

Operating Earnings Reconciliation

Year ended December 31 ($ millions) 2013 2012 2011

Net loss as reported (1 151) (3) (331)
.......................................................................................................................................................................................................................................................

Unrealized foreign exchange loss (gain) on U.S. dollar denominated
debt 521 (157) 161
.......................................................................................................................................................................................................................................................
Impact of income tax rate adjustments on deferred income taxes — (20) —
.......................................................................................................................................................................................................................................................
Impairments and write-offs — — 23

Operating loss(1) (630) (180) (147)

(1) Non-GAAP financial measure. See the Advisories – Non-GAAP Financial Measures section of this MD&A.


Renewable Energy
The increase in operating loss was due primarily to higher

Year ended December 31
2013 2012 2011 interest expense due to lower capitalized interest and
increased financing expense associated with additional
Power generation marketed
(gigawatt hours)
430 429 245
capital leases, higher share-based compensation expense
and incremental expenditures relating to a company-wide ........................................................................................................................
Ethanol production
process improvement initiative. The company capitalized
$397 million of its borrowing costs in 2013 as part of the (thousands of m3)
415 413 382

cost of major projects, compared to $587 million in the
prior year, reflecting fewer major projects in 2013.
Suncor’s renewable energy assets contributed operating

earnings of $72 million in 2013, compared to $57 million
Group Eliminations
in 2012, and increased primarily due to stronger margins

Group Eliminations reflect the elimination of profit on on ethanol sales driven by lower feedstock prices, and
crude oil sales from Oil Sands and East Coast Canada to higher average power prices in 2013.

Refining and Marketing. Consolidated profits are only
realized when the company sells the products produced Energy Trading

from intersegment purchases of crude feedstock to third Energy Trading activities contributed operating earnings of
parties. In 2013, $33 million of after-tax intersegment $116 million in 2013, compared to $147 million in 2012.
profit was eliminated, compared to $84 million after-tax of
Energy trading continued to contribute to operating
previously eliminated intersegment profit that was earnings, primarily through its heavy crude trading
recognized in 2012.
strategies, which were adversely impacted by fluctuating
crude differentials in the latter half of 2013.


Corporate

Corporate had an operating loss of $785 million in 2013,
compared with an operating loss of $468 million in 2012.


SUNCOR ENERGY INC. ANNUAL REPORT 2013 45