Page 48 - Suncor AR English
P. 48
SEGMENT RESULTS AND ANALYSIS
CORPORATE, ENERGY TRADING AND early 2014. Suncor also has positions on a number of
ELIMINATIONS
major proposed pipeline projects, subject to various
approvals and conditions.
• The company continued to progress the Adelaide and
Cedar Point wind projects. The Adelaide project
received regulatory approval in December 2013.
Strategy and Investment Update
The Energy Trading business supports the company’s
production by securing market access, optimizing price
realizations, managing inventory levels during unplanned
outages at Suncor’s facilities and managing the impacts of
external market factors, such as pipeline disruptions or
outages at refining customers, while generating trading
earnings through established strategies.
The company expects to complete the Adelaide wind 2013 Highlights
project by the fourth quarter of 2014. The Cedar Point • The Energy Trading business continued to expand
project continues to progress through the regulatory Suncor’s logistics network by securing market access
process. The two projects, based in Ontario, are expected into Canadian and U.S. Coastal markets, positioning
to add 140 MW of gross installed capacity, increasing the the company to capture global prices on both its
gross installed capacity of Suncor’s wind projects by 55%. current production and future growth.
The focus for the ethanol operations will be to maintain • In addition to the rail projects supporting the Refining
safe and reliable operations and improve plant profitability
through technology improvements.
and Marketing segment, the company increased its
heavy crude capacity to the U.S. Gulf Coast through
the Gulf Coast Pipeline, which began shipments in
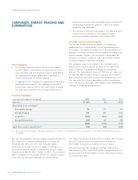
Financial Highlights
2013 2012 2011 Year ended December 31 ($ millions)
(1 151) (3) (331)
Net loss
Operating (loss) earnings(1)
.......................................................................................................................................................................................................................................................
Renewable Energy 72 57 72
.......................................................................................................................................................................................................................................................
Energy Trading 116 147 149
.......................................................................................................................................................................................................................................................
Corporate (785) (468) (346)
.......................................................................................................................................................................................................................................................
Group Eliminations (33) 84 (22)
(630) (180) (147)
(1)
Cash flow used in operations(78) (39)
(246)
(1) Non-GAAP financial measures. Operating earnings are reconciled to net earnings below. See the Advisories – Non-GAAP Financial Measures section of
this MD&A.
Net loss for Corporate, Energy Trading and Eliminations for U.S. dollar denominated debt of $157 million. Net earnings
2013 was $1.151 billion, compared to a net loss of
for 2012 also included a deferred tax reduction of
$3 million for 2012. In 2013, the Canadian dollar $20 million related to an income tax rate change.
weakened in relation to the U.S. dollar, resulting in an The operating loss for Corporate, Energy Trading and
after-tax unrealized foreign exchange loss on U.S. dollar
denominated debt of $521 million. In 2012, the Canadian Eliminations in 2013 was $630 million, compared with an
operating loss of $180 million in 2012. Operating earnings
dollar strengthened in relation to the U.S. dollar, resulting are discussed below.
in an after-tax unrealized foreign exchange gain on
44 SUNCOR ENERGY INC. ANNUAL REPORT 2013