Page 46 - Suncor AR English
P. 46
SEGMENT RESULTS AND ANALYSIS
REFINING AND MARKETING maintenance event at the Sarnia refinery in the fourth
CONTINUED
quarter of 2012.
Refinery utilization in Western North America averaged
96% in 2013, compared to 100% in 2012. The decrease
from the prior year is primarily due to more maintenance
activities occurring in 2013, including a four-week planned
maintenance event at the Edmonton refinery of the heavy
sour crude train and unplanned maintenance in the second
and fourth quarters of 2013, partially offset by higher
utilization at the Commerce City refinery due to stronger
overall reliability in 2013. Despite this unplanned
maintenance, overall demonstrated reliability improvements
resulted in an increase to the nameplate capacity of the
Edmonton refinery to 142,000 bbls/d from 140,000 bbls/d
effective January 1, 2014.
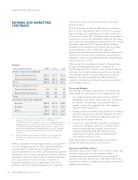
Total sales of refined petroleum products increased to an Volumes
average of 542,900 bbls/d in 2013, compared to
538,500 bbls/d in 2012. Distillate sales increased from the 2013 2012 2011 Year ended December 31
prior year due to higher production and increasing diesel Crude oil processed (mbbls/d)
sales through Suncor’s retail and supply sales channels. ........................................................................................................................
Eastern North America 201.7 197.7 201.3
Gasoline sales decreased from the prior year due to ........................................................................................................................
economic conditions and competitive pressures primarily in Western North America 229.6 233.7 206.4
Eastern North America.
Total
431.3 431.4
407.7
Refinery utilization(1)(2) (%)
........................................................................................................................
Prices and Margins
For Refining and Product Supply, prices and margins for Eastern North America 91 89 94 ........................................................................................................................
refined products were lower in 2013 compared to 2012.
Western North America 96 100 91
• The narrowing differential between Brent and WTI Total
94 95 92
throughout 2013 relative to the prior year contributed Refined Product Sales (mbbls/d)
........................................................................................................................
to a decline in benchmark crack spreads across all Gasoline 247.4 252.8 249.5
regions in which the company sells refined products ........................................................................................................................
Distillate 209.8 195.0 190.7
compared to the prior year.
........................................................................................................................
Other 85.7 90.7 82.5
• Average inland crude differentials to WTI were relatively
consistent year-over-year for SCO. However, the wider 542.9 538.5 522.7
light/heavy crude oil differential positively impacted
earnings for the inland refineries.
(1) Effective January 1, 2013, the company increased the nameplate
capacity of the Edmonton refinery from 135,000 bbls/d to
• In 2013, the impact of FIFO inventory accounting, as 140,000 bbls/d. Effective January 1, 2012, the company increased the
nameplate capacity of the Montreal refinery from 130,000 bbls/d to
used by the company, relative to an estimated LIFO 137,000 bbls/d and the nameplate capacity of the Commerce City
basis of accounting had a positive impact to net refinery from 93,000 bbls/d to 98,000 bbls/d. Prior years’ utilization
earnings of approximately $79 million after-tax, rates have not been recalculated and reflect the lower nameplate
compared to a negative impact of approximately capacities.
(2) Refinery utilization is the amount of crude oil run through crude
$153 million after-tax in 2012.
distillation units, expressed as a percentage of the capacity of
Marketing margins increased primarily due to higher these units.
margins for lubricants and the retail channels.
Refinery utilization in Eastern North America averaged 91%
in 2013, compared to 89% in 2012. Refinery utilization
Expenses and Other Factors
increased over the prior year due to significantly less
Operating expenses were higher in 2013 than in 2012, due unplanned maintenance in 2013, partially offset by planned
to higher energy costs and consumption, higher
maintenance at the Sarnia and Montreal refineries. Refinery
transportation costs associated with increased asphalt utilization in 2012 was impacted by an unplanned outage
volumes and overall delivery rates, and higher repairs and
of a crude unit at the Sarnia refinery, a reduction in
maintenance expense, partially offset by lower share-based feedstock availability in the second quarter due to an
compensation expense.
unplanned Oil Sands upgrader outage and a scheduled
42 SUNCOR ENERGY INC. ANNUAL REPORT 2013