Page 45 - Suncor AR English
P. 45
Refining and Marketing recorded net and operating $153 million after-tax in 2012. Marketing operations
earnings of $2.022 billion in 2013, compared to net contributed $264 million to operating earnings in 2013,
earnings of $2.137 billion and operating earnings of compared to $275 million in 2012, primarily due to higher
$2.152 billion in 2012.
operating expenses, partially offset by higher margins for
lubricants and the retail channel.
Refining and Supply operations contributed $1.758 billion
to operating earnings in 2013, a decrease compared with Cash flow from operations was $2.618 billion in 2013,
2012, primarily due to lower crack spreads, higher compared to $3.138 billion in 2012, and decreased
operating expenses and higher DD&A, partially offset by primarily due to incremental current income tax expense
the impact of FIFO inventory accounting relative to an relating to the company’s Canadian operations recorded in
estimated LIFO basis of accounting, which had a positive 2013, in addition to the majority of the factors that
impact to net earnings of approximately $79 million after- impacted operating earnings.
tax, compared to a negative impact of approximately
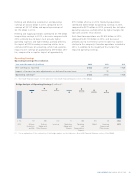
Operating Earnings
Operating Earnings Reconciliation
Year ended December 31 ($ millions)
2013
2012
2011
Net earnings as reported
.......................................................................................................................................................................................................................................................
2 022
2 137
1 726
Impact of income tax rate adjustments on deferred income taxes — 15 —
(1)
Operating earnings2 022
2 152 1 726
(1) Non-GAAP financial measure. See the Advisories – Non-GAAP Financial Measures section of this MD&A.
Bridge Analysis of Operating Earnings ($ millions)(1)
(4) 2 022 2 152 59 (39)
(12) 11 (94) (51)
Financing 2013
2012
Refinery Refinery Inventory
Marketing Operating DD&A
Expense and Production Margin and Margin and and
Other income
and Mix Other Revenue
Volumes Transportation
Expense
24FEB201419252384
(1)
For an explanation of the construction of this bridge analysis, see the Advisories – Non-GAAP Financial Measures section of this MD&A.
SUNCOR ENERGY INC. ANNUAL REPORT 2013 41