Page 53 - Suncor AR English
P. 53
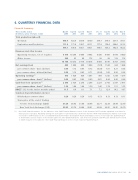
6. QUARTERLY FINANCIAL DATA


Financial Summary

Three months ended Dec 31 Sept 30 June 30 Mar 31 Dec 31 Sept 30 June 30 Mar 31
($ millions, unless otherwise noted) 2013 2013 2013 2013 2012 2012 2012 2012

Total production (mboe/d)
.......................................................................................................................................................................................................................................................

Oil Sands 446.5 423.6 309.4 389.0 378.7 378.9 337.8 341.1 .......................................................................................................................................................................................................................................................

Exploration and Production 111.6 171.4 190.7 207.1 177.8 156.4 204.6 221.2

558.1 595.0 500.1 596.1 556.5 535.3 542.4 562.3
Revenues and other income
.......................................................................................................................................................................................................................................................
Operating revenues, net of royalties 9 814 10 288 9 648 9 843 9 396 9 488 9 584 9 639
.......................................................................................................................................................................................................................................................
Other income 380 85
66 173 92 88 123 116

10 194 10 373
9 714 10 016 9 488
9 576 9 707 9 755

Net earnings (loss) 443 1 694 680
1 094
1 544
324
(574)
1 446
.......................................................................................................................................................................................................................................................
per common share – basic (dollars) 0.30 1.13 0.45 0.72 (0.38) 1.01 0.21 0.93
.......................................................................................................................................................................................................................................................
per common share – diluted (dollars) 0.30 1.13 0.45 0.71 (0.38) 1.00 0.20 0.92

Operating earnings(1) 973 1 426 934 1 367 988 1 292 1 249 1 318
.......................................................................................................................................................................................................................................................
per common share – basic(1) (dollars) 0.66 0.95 0.62 0.90 0.65 0.84 0.80 0.84

Cash flow from operations(1) 2350 2528 2250 2284 2228 2743 2347 2415
.......................................................................................................................................................................................................................................................
per common share – basic(1) (dollars) 1.58 1.69 1.49 1.50 1.46 1.79 1.51 1.55

ROCE(1) (%) for the twelve months ended 11.5 8.6 8.1 7.1 7.2 12.4 14.2 14.7

Common share information (dollars) .......................................................................................................................................................................................................................................................

Dividend per common share 0.20 0.20 0.20 0.13 0.13 0.13 0.13 0.11 .......................................................................................................................................................................................................................................................

Share price at the end of trading
.......................................................................................................................................................................................................................................................

Toronto Stock Exchange (Cdn$) 37.24 36.83 31.00 30.44 32.71 32.34 29.44 32.59 .......................................................................................................................................................................................................................................................

New York Stock Exchange (US$) 35.05 35.78 29.49 30.01 32.98 32.85 28.95 32.70

(1) Non-GAAP financial measures. See the Advisories – Non-GAAP Financial Measures section of this document. ROCE excludes capitalized costs related to
major projects in progress. Operating earnings for each quarter of 2013 and 2012 is defined in the Non-GAAP Financial Measures Advisory section and
reconciled to GAAP measures in the Consolidated Financial Information and Segment Results and Analysis sections of each respective quarterly Report
to Shareholders issued in respect of the relevant quarter for 2013 (Quarterly Reports). Cash flow from operations and ROCE are defined and reconciled

to GAAP measures in the Advisories – Non-GAAP Financial Measures section of each respective Quarterly Report.


SUNCOR ENERGY INC. ANNUAL REPORT 2013 49