Page 56 - Suncor AR English
P. 56
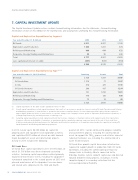
CAPITAL INVESTMENT UPDATE


7. CAPITAL INVESTMENT UPDATE


The Capital Investment Update section contains forward-looking information. See the Advisories – Forward-Looking
Information section of this MD&A for the material risks and assumptions underlying this forward-looking information.


Capital and Exploration Expenditures by Segment

Year ended December 31 ($ millions) 2013 2012 2011

Oil Sands 4 311 4 957 5 100
.......................................................................................................................................................................................................................................................
Exploration and Production 1 483 1 261 874
.......................................................................................................................................................................................................................................................
Refining and Marketing 890 644 633
.......................................................................................................................................................................................................................................................
Corporate, Energy Trading and Eliminations 93 95 243

Total 6 777 6 957 6 850
.......................................................................................................................................................................................................................................................
Less: capitalized interest on debt
(397) (587) (559)

6 380
6 370
6 291


Capital and Exploration Expenditures by Type(1)(2)(3)

Year ended December 31, 2013 ($ millions)
Sustaining
Growth
Total

2 729
1 267
3 996
Oil Sands
.......................................................................................................................................................................................................................................................
Oil Sands Base 1 516 71 1 587
.......................................................................................................................................................................................................................................................
In Situ 814 381 1 195
.......................................................................................................................................................................................................................................................
Oil Sands Ventures 399 815 1 214
.......................................................................................................................................................................................................................................................
Exploration and Production 151 1 250 1 401
.......................................................................................................................................................................................................................................................
Refining and Marketing 770 120 890
.......................................................................................................................................................................................................................................................
Corporate, Energy Trading and Eliminations 75 18 93

3 725 2 655 6 380

(1) Capital expenditures in this table exclude capitalized interest on debt.

(2) Growth capital expenditures include capital investments that result in i) an increase in production levels at existing Oil Sands Operations and Refining
and Marketing operations; ii) new facilities or operations that increase overall production; iii) new infrastructure and logistics that are required to
support higher production levels; iv) new reserves or a positive change in the company’s reserves profile in Exploration and Production operations; or
v) margin improvement, by increasing revenues or reducing costs.

(3) Sustaining capital expenditures include capital investments that i) ensure compliance or maintain relations with regulators and other stakeholders;
ii) improve efficiency and reliability of operations or maintain productive capacity by replacing component assets at the end of their useful lives;
iii) deliver existing proved developed reserves for Exploration and Production operations; or iv) maintain current production capacities at existing Oil
Sands Operations and Refining and Marketing operations.


In 2013, Suncor spent $6.380 billion on capital for quarters of 2013. Suncor continued to progress reliability

property, plant and equipment and exploration activities, and sustainment projects, including the construction of
and capitalized $397 million of interest on debt towards assets to support the TROprocess and activities aimed at
TM
major development assets and construction projects. reducing freshwater use, including the construction of a
Activity in 2013 included the following:
water treatment plant.

Oil Sands Base growth capital focused on infrastructure
Oil Sands Base
required to support growth in production from Oil Sands
Oil Sands Base capital expenditures were $1.587 billion, of Operations, including the commissioning of two new
which $1.516 billion was directed towards sustaining
storage tanks in Hardisty, Alberta connected to the
activities. Sustaining capital expenditures related primarily Enbridge mainline system. Growth capital was also directed
to planned maintenance events, including the Upgrader 1
towards debottlenecking projects, including a recently
turnaround completed in the second quarter of 2013 and completed project in secondary extraction that has
planned maintenance of the Upgrader 2 vacuum tower
increased operational flexibility.
and related units completed in the third and fourth


52 SUNCOR ENERGY INC. ANNUAL REPORT 2013