Page 36 - Suncor AR English
P. 36
SEGMENT RESULTS AND ANALYSIS
282,600 bbls/d in 2013, compared to 276,700 bbls/d in The commissioning of the hot bitumen infrastructure
2012. Record SCO production was achieved despite increased the takeaway capacity of bitumen and unlocked
planned maintenance and a number of third-party outages.
production in mining. However, planned maintenance
The third-party outages consisted of a shutdown of a required the company to scale back mine production
cogeneration facility, which resulted in limited steam particularly in the second quarter of 2013 to coincide with
limited upgrader availability during the Upgrader 1
availability and required a three-day shutdown of
Upgrader 2 in early May and constrained production until turnaround. In 2012, mining activity was also constrained
by low upgrader availability and lower ore grade quality of
early June. Shortly thereafter, a precautionary shutdown of
third-party pipelines in response to flooding in northern the Millennium mining area.
Alberta required the company to scale back production in Bitumen from In Situ operations averaged 171,900 bbls/d
the latter part of June and into mid-July. Further, a third- in 2013, increasing from 131,000 bbls/d in 2012 due
party natural gas outage in the Fort McMurray region in primarily to the ramp up of Firebag production. By the
October impacted Suncor’s steam generation and fourth quarter of 2013, production from the Firebag
upgrading capabilities. Natural gas supply continued to be complex had fully ramped up, with daily production rates
curtailed intermittently for the remainder of the year, reaching approximately 95% of capacity during periods
impacting the company’s steam generation capabilities. that were not impacted by the third-party natural gas
Intermittent curtailments of natural gas supply are expected outage and curtailment. Production was reduced in the
to continue through the first quarter of 2014 while the year due to planned maintenance of a central processing
third-party operator completes its investigations and facility and a third-party cogeneration outage in the second
restoration activities.
quarter of 2013. Production from MacKay River averaged
28,500 bbls/d in 2013, compared to 27,000 bbls/d in
Production of upgraded product in 2012 was impacted by
planned maintenance on various coker units and 2012, and increased primarily due to the commissioning of
replacement well pads in 2013 and increased planned
hydrotreating units in Upgrader 1 and 2, as well as
unplanned maintenance relating to primary and secondary maintenance in the prior year, partially offset by the impact
of third-party outages in 2013.
upgrading at Upgrader 2.
Non-upgraded bitumen production increased to an average Suncor’s share of Syncrude production and sales averaged
32,000 bbls/d in 2013, compared to 34,400 bbls/d in
of 77,900 bbls/d in 2013, compared to 48,100 bbls/d in
2012, primarily as a result of the ramp up of Firebag and 2012. Production in 2013 was impacted by longer than
planned shutdowns of one of three cokers, the LC Finer
the hot bitumen infrastructure.
and secondary upgrading units, resulting in the acceleration
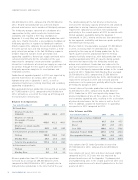
of planned maintenance for the coker as well as the LC Bitumen from Operations
Finer. In addition, unplanned maintenance in upgrading Year ended December 31
2013 2012 2011
was greater in 2013 compared to 2012.
Oil Sands Base
........................................................................................................................
Sales Volumes and Mix
Bitumen Production
(mbbls/d) 269.8 266.2 287.1
2013 2012 2011 ........................................................................................................................
Year ended December 31
Bitumen ore mined
........................................................................................................................
Oil Sands sales volumes (mbbls/d)
(thousands of tonnes
Sweet SCO 91.5 93.8 85.5
per day) 413.6 412.3 441.1 ........................................................................................................................
........................................................................................................................
Diesel 23.5 24.5 24.3
Bitumen ore grade quality
........................................................................................................................
(bbls/tonne) 0.65 0.65
0.65
Sour SCO 166.0 161.1 170.6
In Situ bitumen production (mbbls/d)
Upgraded Product (SCO) 281.0 279.4 280.4
........................................................................................................................
........................................................................................................................
Firebag 143.4 104.0 59.5 Non-upgraded bitumen 76.0 44.5 24.0
........................................................................................................................
MacKay River 28.5 27.0 30.0
357.0 323.9 304.4
Total In Situ production 171.9 131.0 89.5
Sales volumes for Oil Sands Operations increased to
In Situ steam-to-oil ratio
357,000 bbls/d in 2013, compared to 323,900 bbls/d ........................................................................................................................
in 2012.
Firebag 3.3 3.4 3.6 ........................................................................................................................
Sales volumes of sweet SCO and diesel decreased slightly MacKay River 2.6 2.4 2.2
compared to 2012. SCO sales mix was impacted by
planned maintenance of the Upgrader 1 hydrogen plant Bitumen production from Oil Sands Base operations
and hydrotreating units in the second quarter of 2013 and increased to an average of 269,800 bbls/d in 2013,
unplanned maintenance of a diesel hydrotreater in the first compared to 266,200 bbls/d in 2012, primarily due to
quarter of 2013.
strong bitumen production in the latter half of the year.
32 SUNCOR ENERGY INC. ANNUAL REPORT 2013