Page 35 - Suncor AR English
P. 35
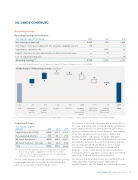
OIL SANDS CONTINUED


Operating Earnings


Operating Earnings Reconciliation

Year ended December 31 ($ millions) 2013 2012 2011
Net earnings as reported 2 040 468 2 603
.......................................................................................................................................................................................................................................................
Net impact of not proceeding with the Voyageur upgrader project 58 — —
.......................................................................................................................................................................................................................................................

Impairments and write-offs — 1 487 35 .......................................................................................................................................................................................................................................................

Impact of income tax rate adjustments on deferred income taxes — 70 — .......................................................................................................................................................................................................................................................

Loss on significant disposals — — 99
Operating earnings(1) 2 098
2 025
2 737


(1) Non-GAAP financial measure. See the Advisories – Non-GAAP Financial Measures section of this MD&A.

Bridge Analysis of Operating Earnings ($ millions)(1)


2 025 452 665
(129) (67) (489)
(375)
16
2 098

2012
Production Price and Royalties
Inventory
Operating DD&A and Financing 2013
Volumes Other and Exploration
Expense and
and Mix Revenue
Transportation Other income

Expense
24FEB201419252514
(1)
For an explanation of the construction of this bridge analysis, see the Advisories – Non-GAAP Financial Measures section of this MD&A.


Production Volumes(1)
The increase in Oil Sands Operations was primarily due to

the ramp up of production at Firebag and the hot bitumen
Year ended December 31 assets commissioned in the third quarter of 2013. These
(mbbls/d)
2013 2012 2011
Upgraded product (SCO)
282.6 276.7 279.7
assets are comprised of an insulated pipeline from Firebag
to Suncor’s Athabasca terminal, bitumen cooling and ........................................................................................................................
Non-upgraded bitumen 77.9 48.1 25.0
blending facilities, and capacity to import third-party
diluents. Record production was achieved despite a number Oil Sands Operations 360.5 324.8 304.7
........................................................................................................................
of third-party outages in the year that contributed to lost Oil Sands Ventures – Syncrude 32.0 34.4 34.6
annual production of 16,000 bbls/d, as well as major
Total 392.5 359.2 339.3
maintenance, including a seven-week turnaround of
Upgrader 1 in the second quarter of 2013 and planned (1) Bitumen from Oil Sands Base operations is upgraded, while bitumen
from In Situ operations is upgraded or sold directly to customers.
maintenance of the Upgrader 2 vacuum tower and related
units in the third and fourth quarters of 2013.
Yields of SCO from Suncor’s upgrading processes are approximately
79% of bitumen feedstock input.
The increase in bitumen production was complemented by
The Oil Sands segment achieved a third consecutive year of
strong upgrading reliability in 2013. Production of record production with an average of 392,500 bbls/d in
upgraded product was the highest on record and averaged
2013, increasing from 359,200 bbls/d in 2012.


SUNCOR ENERGY INC. ANNUAL REPORT 2013 31