Page 34 - Suncor AR English
P. 34
SEGMENT RESULTS AND ANALYSIS
strategies to obtain economies of scale for properties with Earlier in the year, Suncor announced that the company
similar geological characteristics.
was not proceeding with the Voyageur upgrader project.
The decision was a result of a strategic and economic
Suncor continues to work closely with project co-owners
on evaluating and progressing growth projects, including review in response to changes in market conditions that
challenged the economics of the project. As part of the
the Fort Hills and Joslyn North mining projects, respectively.
decision, Suncor acquired Total E&P Canada Ltd’s (Total
The Fort Hills mining project received sanction in the fourth E&P) interest in the Voyageur Upgrader Limited Partnership
quarter of 2013. As operator of the project, Suncor plans
(VULP) to gain full control over the partnerships assets,
to develop the mine using traditional open-pit truck and which are used to provide added logistics flexibility and
shovel techniques, and solvent-based extraction technology
storage capacity for the company’s growing Oil Sands
that will allow the mine to produce a final marketable Operations.
bitumen product. The project is expected to provide Suncor
Suncor and the co-owners of the Joslyn mining project
with approximately 73,000 bbls/d of bitumen, with first oil
expected in the fourth quarter of 2017. Project activities in continue to evaluate the project and plan to provide an
update on the targeted timing of a sanction decision
2014 are expected to focus on detailed engineering,
procurement and the ramp up of field construction when available.
activities.
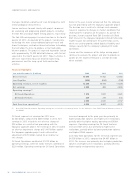
Financial Highlights
Year ended December 31 ($ millions)
2013
2012
2011
Gross revenues
13 089
11 502
12 003
.......................................................................................................................................................................................................................................................
Less: Royalties
(859) (684) (799)
Operating revenues, net of royalties
12 230 10 818 11 204
Net earnings
2 040
468
2 603
Operating earnings(1)
.......................................................................................................................................................................................................................................................
Oil Sands Operations 1 870 1 807 2 425
.......................................................................................................................................................................................................................................................
Oil Sands Ventures 228 218 312
2 098 2 025 2 737
Cash flow from operations(1) 4 556
4 407
4 572
(1) Non-GAAP financial measures. Operating earnings are reconciled to net earnings below. See the Advisories – Non-GAAP Financial Measures section of
this MD&A.
Oil Sands segment net earnings for 2013 were
increased compared to the prior year due primarily to
$2.040 billion, compared to $468 million in 2012. Net higher production volumes and higher price realizations,
earnings in 2013 included a net after-tax charge of
partially offset by higher royalty, operating and DD&A
$58 million as a result of not proceeding with the expenses. Operating earnings for Oil Sands Ventures
Voyageur upgrader project. Net earnings in 2012 included increased from 2012, due primarily to higher price
an after-tax impairment charge of $1.487 billion against realizations, partially offset by lower production volumes
the Voyageur upgrader project and a deferred tax and higher DD&A expense.
adjustment of $70 million related to an income tax
Cash flow from operations for the Oil Sands segment was
rate change.
$4.556 billion in 2013, compared to $4.407 billion in
Oil Sands Operations contributed $1.870 billion to 2012. The increase was primarily due to higher production
operating earnings, while Oil Sands Ventures contributed volumes and higher price realizations, partially offset by
$228 million. Operating earnings for Oil Sands Operations
higher royalty and operating expenses.
30 SUNCOR ENERGY INC. ANNUAL REPORT 2013