Page 38 - Suncor AR English
P. 38
SEGMENT RESULTS AND ANALYSIS
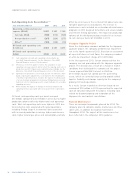
Cash Operating Costs Reconciliation(1)(2)
offset by an increase in the net benefit of power sales due
to higher power prices and volumes. The increase in Year ended December 31
2013
2012
2011
maintenance costs included an acceleration of maintenance
Operating, selling and general
programs in 2013 designed to facilitate and ensure reliable expense (OS&G)
5 837
5 365
5 169
and efficient mining operations. The impact on production ........................................................................................................................
Syncrude OS&G (536) (513) (529)
volumes of the third-party outages resulted in an increase ........................................................................................................................
to cash costs per barrel of $1.60/bbl in 2013.
Non-production costs(3) (267) (328) (275)
........................................................................................................................
Other(4) (165) (129) (10)
Voyageur Upgrader Project
Oil Sands cash operating costs
Given the challenging economic outlook for the Voyageur
upgrader project, the company performed an impairment ($ millions) 4 869 4 395 4 355 ........................................................................................................................
test in the fourth quarter of 2012. Based on an assessment Oil Sands cash operating costs
of expected future net cash flows, the company recorded ($/bbl) 37.00 37.05 39.05
an after-tax impairment charge of $1.487 billion.
(1) Cash operating costs and cash operating costs per barrel are
In the first quarter of 2013, Suncor announced that the non-GAAP financial measures. See the Advisories – Non-GAAP
company was not proceeding with the Voyageur upgrader Financial Measures section of this document.
(2) Effective as of the first quarter of 2012, the calculation of cash
project. The decision was a result of a change in market operating costs was revised to better reflect the ongoing cash costs of
conditions that challenged the economics of the project. production, and 2011 figures were redetermined accordingly. See the
Suncor acquired Total E&P’s interest in VULP for
Advisories – Non-GAAP Financial Measures section of this document.
$515 million to gain full control over the partnership (3) Significant non-production costs include, but are not limited to, share-
assets, which are currently being used to provide added based compensation adjustments, costs related to the remobilization
or deferral of growth projects, research, the expense recorded as part
logistics flexibility and storage capacity for the company’s
growing Oil Sands operations.
of a non-monetary arrangement involving a third-party processor and
feedstock costs for natural gas used to create hydrogen for secondary
As a result, Suncor recorded an after-tax charge to net upgrading processes.
(4) Other includes the impacts of changes in inventory valuation and
earnings of $58 million in 2013 representing the expected operating revenues associated with excess power from cogeneration
costs of not proceeding with the project, including costs
units.
related to decommissioning and restoration of the
Voyageur site and contract cancellations.
Oil Sands cash operating costs per barrel averaged
$37.00/bbl, compared to $37.05/bbl in 2012 due to higher
Planned Maintenance
production volumes offset by higher total cash operating
There are no major turnarounds planned for 2014. The costs. Total cash operating costs were higher in 2013 due
company plans to complete routine maintenance on three to incremental costs associated with larger operations,
coker units, in addition to seasonal maintenance including Firebag Stage 4, incremental costs associated
throughout 2014. The impact of this maintenance has with increased production in mining, higher maintenance
been reflected in the company’s 2014 guidance.
costs, higher natural gas prices and consumption, partially
34 SUNCOR ENERGY INC. ANNUAL REPORT 2013