Page 40 - Suncor AR English
P. 40
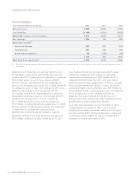
SEGMENT RESULTS AND ANALYSIS


Financial Highlights

Year ended December 31 ($ millions) 2013 2012 2011

Gross revenues 6 363 6 476 6 784
.......................................................................................................................................................................................................................................................
Less: Royalties
(1 146) (1 631) (1 472)

Operating revenues, net of royalties
5 217 4 845 5 312

Net earnings
1 000
138
306

Operating earnings(1)
.......................................................................................................................................................................................................................................................

East Coast Canada 563 422 694 .......................................................................................................................................................................................................................................................

International 567 538 708 .......................................................................................................................................................................................................................................................

North America Onshore 80 (110) (44)

1 210 850 1 358
Cash flow from operations(1) 2 316
2 227
2 846


(1) Non-GAAP financial measures. Operating earnings are reconciled to net earnings below. See the Advisories – Non-GAAP Financial Measures section of
this MD&A.


Exploration and Production net earnings for 2013 were were higher primarily due to larger planned off-station
$1.000 billion, compared to $138 million for 2012. Net maintenance programs in the prior year. Operating

earnings for 2013 included after-tax impairment charges of earnings for International were $567 million for 2013,
$563 million against assets in Syria, Libya and North compared to $538 million for 2012, and were higher

America Onshore, partially offset by the recognition of primarily due to increased production in the U.K., partially
after-tax risk mitigation proceeds of $223 million related to offset by lower production volumes in Libya. Operating

the company’s assets in Syria. Net earnings for 2013 were earnings for North America Onshore were $80 million for
positively impacted by an after-tax gain on sale of
2013, compared with an operating loss of $110 million for

$130 million related to the disposition of the company’s 2012, primarily due to the cessation of DD&A on
conventional natural gas business. Net earnings for 2012 properties that were classified as held for sale since

included after-tax impairments (net of reversals) of
February 2013 and subsequently sold in September 2013,
$517 million for assets in Syria, after-tax charges of
partially offset by lower production volumes.

$172 million, including impairments against assets in North Cash flow from operations was $2.316 billion in 2013,
America Onshore and East Coast Canada, and a provision
compared to $2.227 billion in 2012, and increased
in North America Onshore for estimated future primarily due to higher production volumes at East Coast
commitments relating to unutilized pipeline capacity.
Canada, partially offset by lower production in Libya and
Operating earnings in 2013 for East Coast Canada were incremental current income tax expense relating to the

$563 million, compared to $422 million for 2012, and
company’s Canadian operations in 2013.


36 SUNCOR ENERGY INC. ANNUAL REPORT 2013