Page 42 - Suncor AR English
P. 42
SEGMENT RESULTS AND ANALYSIS
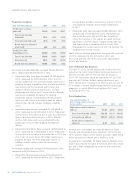
Production Volumes
increased due to higher maintenance activity in 2012,
Year ended December 31
2013 2012 2011 and improved reliability and reservoir performance
in 2013.
Production volumes
(mboe/d)
169.9 189.9 206.7
•
Production from Libya averaged 20,600 bbls/d in 2013,
........................................................................................................................
compared to 41,500 bbls/d in 2012. Production was East Coast Canada
shut-in for the latter half of 2013 due to political
(mbbls/d) 56.2 46.5 65.6
unrest that resulted in the closure of export terminal ........................................................................................................................
operations at eastern Libyan seaports. Production was International (mboe/d) 76.4 89.5 76.4
........................................................................................................................
also impacted by a temporary shut-in at one field North America Onshore
throughout the second quarter of 2013 to facilitate the (mmcfe/d)
224 323
388
establishment of field security.
Production Mix
(liquids/gas) (%)
80/20 74/26 64/36
........................................................................................................................
North America Onshore production averaged 224 mmcfe/d
in 2013, compared to 323 mmcfe/d in 2012, and East Coast Canada 100/0 100/0 100/0
........................................................................................................................
decreased primarily due to the sale of the conventional International 98/2 99/1 82/18
natural gas business.
........................................................................................................................
North America Onshore 14/86 10/90 8/92
Sale of Natural Gas Business
On April 15, 2013, Suncor announced it had reached an East Coast Canada production averaged 56,200 bbls/d in
agreement to sell its conventional natural gas business in 2013, compared to 46,500 bbls/d in 2012.
Western Canada, with an effective date of January 1, • Production from Terra Nova averaged 14,200 bbls/d in
2013. The transaction closed on September 26, 2013 for
2013, compared to 8,800 bbls/d in 2012. In 2013,
proceeds of $1 billion, before closing adjustments and Suncor completed a ten-week off-station maintenance
other closing costs, resulting in an after-tax gain on sale of
$130 million. Suncor’s unconventional oil and natural gas program to repair a mooring chain, perform preventive
maintenance on the remaining eight chains and
properties in central Alberta and northeast B.C. were
excluded from the sale.
complete routine planned maintenance. In 2012,
production was shut-in for 27 weeks for the dockside
maintenance program to replace the floating Price Realizations
production storage and offloading (FPSO) platform
water injection swivel and perform work on subsea Year ended December 31
infrastructure to help mitigate hydrogen sulphide Net of transportation costs, but
before royalties
2013 2012 2011
issues.
Exploration and Production
• Production from Hibernia averaged 27,100 bbls/d in ($/boe)
91.44 84.05 79.95
2013, compared to 26,100 bbls/d in 2012. Production ........................................................................................................................
East Coast Canada ($/bbl) 112.39 112.15 108.42
increased over the prior year due in part to a four-week ........................................................................................................................
shut-in for planned maintenance in 2012. Natural International ($/boe) 107.57 108.22 100.89
........................................................................................................................
declines from older wells were partially offset by North America Onshore
production increases from ongoing development ($/mcfe)
4.74 3.28 4.39
drilling.
• Production from White Rose averaged 14,900 bbls/d in Average price realizations for crude oil from East Coast
2013, compared to 11,600 bbls/d in 2012. Production Canada and International were consistent with 2012 due
increased over the prior year as production in 2012 was to the positive impact of the weaker Canadian dollar being
shut-in for 15 weeks for an off-station maintenance offset by lower benchmark prices for Brent crude.
program to repair the FPSO propulsion system, in Average price realizations for North America Onshore were
addition to other routine planned maintenance
higher due primarily to higher benchmark prices for natural
activities.
gas and a higher proportion of crude oil and natural gas
International production averaged 76,400 boe/d in 2013, liquids sales.
compared to 89,500 boe/d in 2012.
• Production from Buzzard averaged 55,800 boe/d in
2013, compared to 48,000 boe/d in 2012. Production
38 SUNCOR ENERGY INC. ANNUAL REPORT 2013