Page 56 - AIF - English
P. 56
STATEMENT OF RESERVES DATA AND OTHER OIL AND GAS INFORMATION
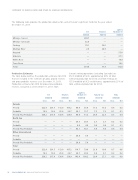
The following table provides the production volumes for each of Suncor’s significant fields for the year ended
December 31, 2013.
Light &
SCO
Bitumen
Medium Oil
mbbls/d
mbbls/d
mbbls/d
Mining – Suncor 209.7
—
—
.......................................................................................................................................................................................................................................................
Mining – Syncrude 32.0 — —
.......................................................................................................................................................................................................................................................
Firebag 70.1 53.0 —
.......................................................................................................................................................................................................................................................
MacKay River 2.8 24.9 —
.......................................................................................................................................................................................................................................................
Buzzard — — 55.8
.......................................................................................................................................................................................................................................................
Hibernia — — 27.1
.......................................................................................................................................................................................................................................................
White Rose — — 14.9
.......................................................................................................................................................................................................................................................
Terra Nova — — 14.2
Total
314.6 77.9 112.0
Production Estimates
Suncor’s mining operations (excluding Syncrude) are
The table below outlines the production estimates for 2014 252.8 mbbls/d of SCO, approximately 40% of total
that are included in the estimates of gross proved reserves estimated production for 2014; and from Firebag are
and gross probable reserves as at December 31, 2013. 155.9 mbbls/d of SCO and bitumen, approximately 25% of
Production estimates for 2014 for proved plus probable total estimated production for 2014.
reserves, evaluated as at December 31, 2013: from
Light &
SCO Bitumen Medium Oil
Natural Gas NGLs
(mbbls/d)
(mbbls/d)
(mbbls/d) (mmcf/d)
(mbbls/d)
Gross
Net
Gross
Net
Gross Net
Gross Net
Gross Net
Canada
.......................................................................................................................................................................................................................................................
Proved 322.9 301.5 113.0 105.2 49.4 35.6 17.3 15.3 0.4 0.3
.......................................................................................................................................................................................................................................................
Probable 16.3 14.3 25.4 23.7 20.1 15.7 7.5 7.2 0.1 0.1
Proved Plus Probable 339.2 315.8 138.4 128.9 69.4 51.3 24.8 22.5 0.5 0.4
.......................................................................................................................................................................................................................................................
North Sea
Proved — — — — 38.5 38.5 3.7 3.7 0.3 0.3
.......................................................................................................................................................................................................................................................
Probable — — — — 4.6 4.6 0.9 0.9 0.1 0.1
Proved Plus Probable — — — — 43.1 43.1 4.6 4.6 0.4 0.4
Other International
.......................................................................................................................................................................................................................................................
Proved — — — — 30.9 5.8 — — — —
.......................................................................................................................................................................................................................................................
Probable ——————————
Proved Plus Probable — — — — 30.9 5.8 — — — —
Total
.......................................................................................................................................................................................................................................................
Proved 322.9 301.5 113.0 105.2 118.7 79.9 21.0 19.0 0.7 0.6
.......................................................................................................................................................................................................................................................
Probable 16.3 14.3 25.4 23.7 24.7 20.3 8.4 8.1 0.2 0.2
Proved Plus Probable 339.2 315.8 138.4 128.9 143.4 100.2 29.4 27.1 0.9 0.8
54 SUNCOR ENERGY INC. ANNUAL INFORMATION FORM 2014