Page 54 - AIF - English
P. 54
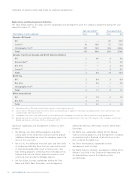
STATEMENT OF RESERVES DATA AND OTHER OIL AND GAS INFORMATION


Exploration and Development Activities

The table below outlines the gross and net exploratory and development wells the company completed during the year
ended December 31, 2013.

Exploratory Wells(1) Development Wells

Total number of wells completed Gross Net Gross Net

Canada – Oil Sands
.......................................................................................................................................................................................................................................................
Oil — — 35 35.0
.......................................................................................................................................................................................................................................................
Service(2) 10 10.0 52 52.0
.......................................................................................................................................................................................................................................................
Stratigraphic Test(3) 187 74.0 539 292.6

Total 197 84.0 626 379.6
Canada – East Coast Canada and North America Onshore
.......................................................................................................................................................................................................................................................
Oil 2 0.6 9 4.3
.......................................................................................................................................................................................................................................................
Natural Gas(4) — — 5 5.0
.......................................................................................................................................................................................................................................................
Dry Hole — — 2 0.4
.......................................................................................................................................................................................................................................................
Service(2) — — 3 0.7

Total 2 0.6 19 10.4

North Sea
.......................................................................................................................................................................................................................................................
Oil 2 0.8 3 0.9
.......................................................................................................................................................................................................................................................
Dry Hole 1 0.3 1 0.3
.......................................................................................................................................................................................................................................................
Stratigraphic Test(3) — — — —

Total 3 1.1 4 1.2

Other International
.......................................................................................................................................................................................................................................................
Oil 2 1.0 2 1.0
.......................................................................................................................................................................................................................................................
Dry Hole 3 1.5 — —

Total 5 2.5 2 1.0

(1) Exploratory wells for Oil Sands include activity related to technology pilot projects.

(2) Service wells for Oil Sands include the injection well in a SAGD well pair, in addition to observation and disposal wells. Service wells for East Coast
Canada include water injection wells.
(3) Stratigraphic test wells for Oil Sands include core hole drilling wells. Stratigraphic test wells for offshore properties include appraisal wells.

(4) Natural Gas wells do not reflect four wells drilled in properties that were included as part of the sale of the majority of the company’s conventional
Natural Gas business, which was effective on January 1, 2013.


Significant exploration and development activities in 2013 drilling for Hibernia, White Rose and the White Rose
included:
Extensions.

• For Mining, core hole drilling programs and other • For North Sea, exploration drilling for the Romeo,

survey work at Oil Sands Base and Syncrude to provide Scotney and Lily prospects, and development, including
additional information on areas the company expects to an appraisal well at Buzzard, all of which are in the

mine in the near term.
U.K. sector of the North Sea.

• For In Situ, the drilling of new well pairs and infill wells • For Other International, exploration and oil
at Firebag and MacKay River that are expected to assist
development wells in Libya.

in maintaining production levels in future years, core • For North America Onshore, development drilling of the
hole drilling programs at MacKay River, Meadow Creek,
Wilson Creek field in the Cardium oil formation and
Firebag and Lewis to further delineate resources, and the Kobes/Altares area in the Montney shale
activity to start up pilot technology projects.
gas formation.
• For East Coast Canada, exploration drilling for Terra

Nova and White Rose Extensions, and development


52 SUNCOR ENERGY INC. ANNUAL INFORMATION FORM 2014