Page 55 - AIF - English
P. 55
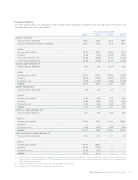
Production History

The table below outlines the company’s historical production information, by product type. Average price realized is net of
transportation costs, but before royalties.


Three months ended in 2013
Mar 31 Jun 30 Sept 30 Dec 31

Canada – Oil Sands(1)
.......................................................................................................................................................................................................................................................
Total production (mbbls/d) 389.0 309.4 423.6 446.5
.......................................................................................................................................................................................................................................................
Total In Situ bitumen production (mbbls/d) 165.5 157.5 181.9 182.4
.......................................................................................................................................................................................................................................................
.......................................................................................................................................................................................................................................................
($/bbl)
.......................................................................................................................................................................................................................................................
Average price realized 79.76 85.87 99.49 73.34
.......................................................................................................................................................................................................................................................
Royalties (4.94) (3.30) (10.05) (4.91)
.......................................................................................................................................................................................................................................................
Total cash operating costs (35.36) (46.09) (33.76) (37.09)
.......................................................................................................................................................................................................................................................
In Situ cash operating costs (16.80) (16.70) (15.15) (17.50)
Canada – Light & Medium Oil
.......................................................................................................................................................................................................................................................
Total production (mbbls/d) 58.4 57.8 62.4 46.3
.......................................................................................................................................................................................................................................................
.......................................................................................................................................................................................................................................................
($/bbl)
.......................................................................................................................................................................................................................................................
Average price realized 112.57 103.68 116.94 116.48
.......................................................................................................................................................................................................................................................
Royalties (26.61) (23.70) (30.23) (32.77)
.......................................................................................................................................................................................................................................................
Production costs (9.05) (11.44) (9.46) (15.90)

Netback 76.91 68.54 77.25 67.81
Canada – Natural Gas(2)
.......................................................................................................................................................................................................................................................
Total production (mmcfe/d) 309 289 273 27
.......................................................................................................................................................................................................................................................

.......................................................................................................................................................................................................................................................
($/mcfe)
.......................................................................................................................................................................................................................................................
Average price realized 4.66 5.30 4.28 6.92
.......................................................................................................................................................................................................................................................
Royalties (0.58) (0.49) (0.37) (0.52)
.......................................................................................................................................................................................................................................................
Production costs (1.43) (1.82) (1.84) (1.75)

Netback 2.65 2.99 2.07 4.65
North Sea – Light & Medium Oil(3)
.......................................................................................................................................................................................................................................................
Total production (mboe/d) 55.3 57.8 50.4 59.8
.......................................................................................................................................................................................................................................................

.......................................................................................................................................................................................................................................................
($/boe)
.......................................................................................................................................................................................................................................................

Average price realized 110.94 99.77 111.00 108.53
.......................................................................................................................................................................................................................................................
Royalties — — — —
.......................................................................................................................................................................................................................................................
Production costs (5.80) (6.29) (7.64) (4.94)
Netback 105.14 93.48 103.36 103.59

Other International – Light & Medium Oil
.......................................................................................................................................................................................................................................................
Total production (mboe/d) 41.9 27.0 13.1 1.0
.......................................................................................................................................................................................................................................................

.......................................................................................................................................................................................................................................................
($/boe)
.......................................................................................................................................................................................................................................................
Average price realized 110.36 104.21 — —
.......................................................................................................................................................................................................................................................
Royalties (41.81) (79.56) — —
.......................................................................................................................................................................................................................................................

Production costs (3.34) (3.47) — —
Netback 65.21 21.18 — —

(1) Suncor measures cash operating cost on a production volumes basis for its Oil Sands Operations, which includes more expenses than production costs.

For this reason, a netback calculation for SCO and bitumen is not presented in this table. Amounts presented include results from the company’s share
in the Syncrude joint operation.
(2) Volumes include NGLs and crude oil from North America Onshore operations.
(3) Volumes include field production for associated gas and NGLs.


SUNCOR ENERGY INC. ANNUAL INFORMATION FORM 2014 53