Page 49 - AIF - English
P. 49
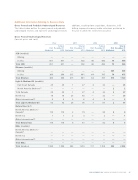
Additional Information Relating to Reserves Data

Gross Proved and Probable Undeveloped Reserves
additions, resulting from acquisitions, discoveries, infill

The tables below outline the gross proved and probable drilling, improved recovery and/or extensions pertaining to
undeveloped reserves and represent undeveloped reserves
the year in which the events first occurred.


Gross Proved Undeveloped Reserves

(forecast prices and costs)

Prior
2011
2012
2013

Total at Total at Total at Total at
First December 31 First December 31
First December 31
First December 31
Attributed 2010 Attributed 2011 Attributed 2012 Attributed 2013

SCO (mmbbls) .......................................................................................................................................................................................................................................................

Mining — —— —— —— — .......................................................................................................................................................................................................................................................

In Situ 651 651 — 502 46 493 75 564

Total SCO 651 651 — 502 46 493 75 564
Bitumen (mmbbls)
.......................................................................................................................................................................................................................................................
Mining — — — — — — 845 845
.......................................................................................................................................................................................................................................................
In Situ 360 360 315 661 64 785 74 875

Total Bitumen 360 360 315 661 64 785 918 1 720

Light & Medium Oil (mmbbls)
.......................................................................................................................................................................................................................................................
East Coast Canada 28 28 1 27 4 32 — 26
.......................................................................................................................................................................................................................................................
North America Onshore(1) — — — — — — 2 2
.......................................................................................................................................................................................................................................................
Total Canada 28 28 1 27 4 32 2 27
.......................................................................................................................................................................................................................................................
North Sea 19 19 25 43 — 32 — 25
.......................................................................................................................................................................................................................................................
Other International(2) 6 6 2 6 4 4 — 5

Total Light & Medium Oil 53 53 28 76 7 67 2 57

Natural Gas (bcf)
.......................................................................................................................................................................................................................................................
North America Onshore –
Canada(1) 118 118 2 79 — 80 4 4
.......................................................................................................................................................................................................................................................
North Sea 1 1 2 3 — 2 — 1
.......................................................................................................................................................................................................................................................
Other International(2) — — — — — — — —

Total Natural Gas 119 119 4 81 — 82 4 5

NGLs (mmbbls)
.......................................................................................................................................................................................................................................................
North America Onshore –
Canada(1) — —— —— —— —
.......................................................................................................................................................................................................................................................
North Sea — — — — — — — —
.......................................................................................................................................................................................................................................................
Other International(2)
—
— —
— —
— —
—

Total NGLs — — — — —
— —
—

Total (mmboe)
1 084
1 084 343
1 253 117 1 359 996 2 342


SUNCOR ENERGY INC. ANNUAL INFORMATION FORM 2014 47