Page 50 - AIF - English
P. 50
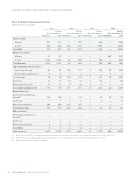
STATEMENT OF RESERVES DATA AND OTHER OIL AND GAS INFORMATION


Gross Probable Undeveloped Reserves

(forecast prices and costs)

Prior
2011
2012
2013

Total at Total at Total at Total at
First December 31 First December 31
First December 31
First December 31
Attributed 2010 Attributed 2011 Attributed 2012 Attributed 2013

SCO (mmbbls) .......................................................................................................................................................................................................................................................

Mining 215 215 — 263 — 260 — 265 .......................................................................................................................................................................................................................................................

In Situ 400 400 916 1 212 — 1 043 — 1 074
Total SCO 615 615 916 1 475 — 1 303 — 1 339

Bitumen (mmbbls)
.......................................................................................................................................................................................................................................................
Mining 37 37 — — — — 397 397
.......................................................................................................................................................................................................................................................
In Situ 1 835 1 835 38 669 — 594 — 369

Total Bitumen 1 872 1 872 38 669 — 594 397 766

Light & Medium Oil (mmbbls)
.......................................................................................................................................................................................................................................................
East Coast Canada 85 85 143 217 4 222 21 235
.......................................................................................................................................................................................................................................................
North America Onshore(1) 4 4 1 2 — — 1 1

Total Canada 89 89 144 219 5 222 22 236
.......................................................................................................................................................................................................................................................
North Sea 15 15 14 17 2 33 — 23
.......................................................................................................................................................................................................................................................
Other International(2) 11 11 4 14 8 8 — 9

Total Light & Medium Oil 115 115 161 251 14 262 22 267

Natural Gas (bcf) .......................................................................................................................................................................................................................................................

North America Onshore –
Canada(1) 136 136 3 87 1 49 15 19
.......................................................................................................................................................................................................................................................
North Sea 1 1 1 2 — 3 — 2
.......................................................................................................................................................................................................................................................
Other International(2) 240 240 221 347 — — — —

Total Natural Gas 377 377 226 436 1 52 15 21

NGLs (mmbbls)
.......................................................................................................................................................................................................................................................
North America Onshore –
Canada(1) 1 1— 1— 1— —
.......................................................................................................................................................................................................................................................
North Sea — — — — — — — —
.......................................................................................................................................................................................................................................................
Other International(2)
8 8 6 11 — — — —

Total NGLs 9 9 6 12 — 1 — —

Total (mmboe)
2 673 2 673 1 159 2 480 14 2 170 422 2 376

(1) North America Onshore – Canada includes additional properties previously held by Suncor and subsequently disposed of in 2011 and 2013.

(2) Other International includes additional properties held by Suncor in Syria which were classified as contingent resources in 2012.
(3) Figures above may not add due to rounding.


48 SUNCOR ENERGY INC. ANNUAL INFORMATION FORM 2014