Page 47 - AIF - English
P. 47
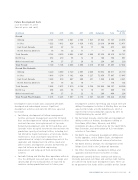
Future Development Costs

as at December 31, 2013
(forecast prices and costs)

Discounted
($ millions)
2014 2015
2016 2017
2018 Remainder
Total
At 10%

Proved
.......................................................................................................................................................................................................................................................
Mining 3 141 3 785 3 641 2 780 1 927 35 833 51 107 23 816
.......................................................................................................................................................................................................................................................
In Situ 1 333 1 013 926 1 026 1 052 29 319 34 669 12 471
.......................................................................................................................................................................................................................................................
East Coast Canada 241 47 14 50 17 106 475 380
.......................................................................................................................................................................................................................................................
North America Onshore 18 14 22 11 — — 65 54
.......................................................................................................................................................................................................................................................
Total Canada 4 733 4 859 4 603 3 867 2 996 65 258 86 316 36 721
.......................................................................................................................................................................................................................................................
North Sea 352 210 56 12 10 144 784 661
.......................................................................................................................................................................................................................................................
Other International 64 37 27 20 13 234 395 220

Total Proved 5 149 5 106 4 686 3 899 3 019 65 636 87 495 37 602

Proved Plus Probable
.......................................................................................................................................................................................................................................................
Mining 3 220 3 869 3 729 2 895 2 046 50 852 66 611 26 119
.......................................................................................................................................................................................................................................................
In Situ 1 418 1 274 1 182 830 1 227 72 056 77 987 15 047
.......................................................................................................................................................................................................................................................
East Coast Canada 1 238 814 667 390 251 1 030 4 390 3 331
.......................................................................................................................................................................................................................................................
North America Onshore 50 18 32 19 — — 119 102
.......................................................................................................................................................................................................................................................
Total Canada 5 926 5 975 5 610 4 134 3 524 123 938 149 107 44 599
.......................................................................................................................................................................................................................................................
North Sea 386 233 56 13 10 151 849 716
.......................................................................................................................................................................................................................................................
Other International 64 37 31 23 13 296 464 234

Total Proved Plus Probable 6 376 6 245 5 697
4 170 3 547 124 385 150 420 45 549


Development costs include costs associated with both Development activities for Firebag also include infill well
developed and undeveloped reserves. Significant drilling. Development activities at MacKay River are also

development activities and costs for 2014 are expected expected to include a facility debottleneck, which is
to include:
expected to increase production capacity by 20% to
38,000 bbls/d by the end of 2015.
• For Mining, development of tailings management
facilities and water management assets for Oil Sands • For East Coast Canada, construction and development

Base and development of tailings management facilities drilling activities at Hebron, development drilling at
and costs for mine train replacements at Syncrude. Terra Nova, White Rose, Hibernia, and HSEU,

Remaining development costs for Oil Sands Base and installation of subsea infrastructure for the South White
Syncrude relate to capital investments that maintain the Rose Extension, and continuation of HS remediation
2
production capacity of existing facilities, including, but activities at Terra Nova.
not limited to, major maintenance at Syncrude, routine
• For North Sea, at Buzzard, development drilling and
maintenance, truck and shovel replacement, the facility upgrades, and at Golden Eagle, development
replenishment of catalysts in hydrotreating units at the
drilling and the installation of subsea infrastructure.
upgraders and improvements to utilities, roads and
other facilities. Development activities for Fort Hills are • For North America Onshore, the development of the
Wilson Creek field in the Cardium oil formation.
expected to focus on detailed engineering,
procurement, and ramp-up of field construction • For Other International, development drilling, and

activities.
upgrades and maintenance to facilities in Libya.

• For both Firebag and MacKay River operations within In Management currently believes existing cash balances,
Situ, the drilling of new well pairs and the design and internally generated cash flows and existing credit facilities

construction of new well pads that are expected to are sufficient to fund future development costs. There can
maintain existing production levels in future years.
be no guarantee that funds will be available or that Suncor


SUNCOR ENERGY INC. ANNUAL INFORMATION FORM 2014 45