Page 46 - AIF - English
P. 46
STATEMENT OF RESERVES DATA AND OTHER OIL AND GAS INFORMATION
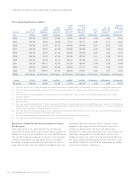
Prices Impacting Reserves Tables(1)
Light Pentanes National
WTI
WCS Sweet Plus B.C. Gas Balancing
Hardisty Edmonton Edmonton Westcoast Point Brent Cushing AECO
Alberta(3)
Alberta(4) Alberta(5)
Station 2(7)
North Sea(8)
Forecast
North Sea(2)
Oklahoma
Gas(6)
Cdn$/bbl
Cdn$/bbl Cdn$/bbl
Cdn$/mmbtu
Cdn$/mmbtu
Year
US$/bbl
US$/bbl
Cdn$/mmbtu
75.60
3.88
11.32
2014
107.50
97.50
92.76 105.20
4.03
.......................................................................................................................................................................................................................................................
2015 107.50 97.50 79.36 97.37 107.11 4.26 4.11 11.32
.......................................................................................................................................................................................................................................................
2016 105.00 97.50 81.50 100.00 107.00 4.50 4.35 11.05
.......................................................................................................................................................................................................................................................
2017 102.50 97.50 81.50 100.00 107.00 4.74 4.59 10.79
.......................................................................................................................................................................................................................................................
2018 102.50 97.50 81.50 100.00 107.00 4.97 4.82 10.79
.......................................................................................................................................................................................................................................................
2019 102.50 97.50 81.50 100.00 107.00 5.21 5.06 10.79
.......................................................................................................................................................................................................................................................
2020 102.50 98.54 82.13 100.77 107.82 5.33 5.18 10.79
.......................................................................................................................................................................................................................................................
2021 103.38 100.51 83.76 102.78 109.97 5.44 5.29 10.88
.......................................................................................................................................................................................................................................................
2022 105.45 102.52 85.44 104.83 112.17 5.55 5.40 11.10
.......................................................................................................................................................................................................................................................
2023 107.56 104.57 87.14 106.93 114.41 5.66 5.51 11.32
.......................................................................................................................................................................................................................................................
2024+
+2.0%/year +2.0%/year +2.0%/year +2.0%/year +2.0%/year +2.0%/year +2.0%/year +2.0%/year
Constant
US$/bbl US$/bbl Cdn$/bbl Cdn$/bbl Cdn$/bbl Cdn$/mmbtu Cdn$/mmbtu Cdn$/mmbtu
All years
109.05 96.90 73.66 91.50 103.39 3.10 3.06 10.74
(1) Each price from the GLJ forecast was adjusted for quality differentials and transportation costs applicable to the specific product and evaluation area.
(2) Price used when determining light and medium oil reserves presented as East Coast Canada reserves, North Sea reserves and Other International
reserves.
(3) Price used when determining bitumen reserves presented as In Situ and Mining reserves, as well as for determining bitumen pricing for royalty
calculation purposes.
(4) Price used when determining SCO reserves presented as In Situ and Mining reserves, and light and medium oil reserves presented as North America
Onshore reserves.
(5) Price used when determining the cost of diluent associated with bitumen reserves presented as In Situ and Mining reserves, as well as for determining
bitumen pricing for royalty calculation purposes. A bitumen/diluent ratio of approximately two to three barrels of bitumen for one barrel of diluent was
used. Price also used when determining certain NGL reserves.
(6) Price used when determining natural gas reserves in Alberta presented as North America Onshore reserves. Price also used when determining natural
gas input costs for the production of SCO and bitumen reserves.
(7) Price used when determining natural gas reserves in B.C. presented as North America Onshore reserves.
(8) Price used when determining natural gas reserves presented as North Sea reserves.
Disclosure of After-Tax Net Present Values of Future determined by their respective EPSAs. Suncor’s actual
Net Revenue
corporate legal entity structure for income taxes and
Values presented in the table for Net Present Value of income tax planning has not been considered, and,
Future Net Revenues After Income Taxes reflect income tax therefore, the total value for income taxes presented in the
burdens of assets at an individual asset level (for Mining, In table may not provide an estimate of the value at the
Situ and East Coast Canada) or at a business area or legal corporate entity level, which may be significantly different.
entity level (for North Sea and North America Onshore) The 2013 audited Consolidated Financial Statements and
based on tax pools associated with that business area or the MD&A should be consulted for information on income
legal entity. Income taxes for Other International assets are
taxes at the corporate entity level.
44 SUNCOR ENERGY INC. ANNUAL INFORMATION FORM 2014