Page 24 - AIF - English
P. 24
NARRATIVE DESCRIPTION OF SUNCOR’S BUSINESSES
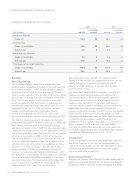
Exploration and Production Sales Summary:
2013
2012
% operating % operating
Sales Volumes
mboe/d
revenues
mboe/d
revenues
East Coast Canada
.......................................................................................................................................................................................................................................................
Crude oil 55.9 40 46.7 33 .......................................................................................................................................................................................................................................................
.......................................................................................................................................................................................................................................................
International
Crude oil and NGLs 75.2 53 88.5 59 .......................................................................................................................................................................................................................................................
Natural gas 1.2 0 1.0 1 .......................................................................................................................................................................................................................................................
.......................................................................................................................................................................................................................................................
North America Onshore
Crude oil and NGLs 5.3 3 5.6 3 .......................................................................................................................................................................................................................................................
Natural gas 32.0 4 48.3 4
Total Exploration and Production
.......................................................................................................................................................................................................................................................
Crude oil and NGLs 136.4 96 140.8 95 .......................................................................................................................................................................................................................................................
Natural gas
33.2 4 49.3 5
Royalties
depending on the price for WTI. The HSEU tier three
East Coast Canada
royalty will coincide with the triggering of the tier one net
royalty. During 2013, Hibernia (including the HSEU)
The Terra Nova royalty consists of a sliding-scale, basic
royalty payable throughout the project’s life, with two tiers royalties and NPI combined to average 36% of gross
revenue (2012 – 35%).
of incremental royalties, which became payable upon the
achievement of specified levels of profitability. The basic The White Rose royalty for the base project consists of a
royalty is now capped at 10% of gross field revenue, based sliding-scale basic royalty payable, with two tiers of
on the project reaching a specified cumulative production incremental royalties, which became payable upon the
level. The tier one royalty is 30% of net revenue, and achievement of specified levels of profitability. The basic
became payable in 2005. Net revenue is gross revenue royalty is now capped at 7.5% of gross field revenue,
adjusted for eligible operating and capital costs. The tier based on the base project reaching a specified cumulative
two royalty, equal to 12.5% of net revenue, became production level. The tier one royalty is 20% of net
payable in 2008. During 2013, Terra Nova royalties revenue, and became payable in 2007. The tier two royalty,
averaged 12% of gross revenue (2012 – 36%) and equal to 10% of net revenue, became payable in 2008.
decreased primarily due to higher deductible costs in 2013.
The royalty for production from the White Rose Extensions
is similar to the base project, except that there is an
The Hibernia royalty agreement for production from the
original oilfields and the AA Block consists of a sliding-scale additional tier three royalty, equal to 6.5% of net revenue,
which is payable if WTI is greater than Cdn$50/bbl.
gross royalty, two tiers of incremental royalty, and an
additional net profits interest (NPI). The basic royalty is now Currently, the White Rose Extensions are only subject to a
2.5% gross royalty. During 2013, total White Rose royalties
capped at 5% of gross revenue, as the project has reached averaged 16% of gross revenue (2012 – 12%).
a specified cumulative production level. The tier one royalty,
which became payable in 2009, is 30% of net revenue.
The tier two royalty is 12.5% of net revenue, but has not International
yet been triggered. Production from the AA Block, which There are no royalties on oil and gas production from the
commenced in late 2009, attracts an additional tier three North Sea; however, in the U.K., oil and gas profits are
royalty of 12.5% of net revenue. The NPI, which also subject to a 62% income tax rate. For operations in Libya
and Syria, all government interests, except for income
became payable in 2009, is an additional 10% of net
revenue. Limited production from the HSEU began in 2011. taxes, are presented as royalties.
The HSEU has a similar royalty structure (gross, tier one and
tier two) to that described above for Hibernia. Currently, North America Onshore
Royalties for Suncor’s North America Onshore production in
Suncor is subject to a 5% gross royalty. HSEU production
will be subject to an additional tier three royalty that Alberta are regulated primarily by the Natural Gas Royalty
Regulation 2009, and by the Petroleum Royalty Regulation
ranges between 2.5% and 7.5% of net revenue,
22 SUNCOR ENERGY INC. ANNUAL INFORMATION FORM 2014