Page 26 - AIF - English
P. 26
NARRATIVE DESCRIPTION OF SUNCOR’S BUSINESSES
Western North America
operations. A majority of crude feedstock is supplied from
Effective January 1, 2014, Suncor increased the nameplate sources in the U.S., primarily the Rocky Mountain region,
capacity of the Edmonton refinery to 142 mbbls/d from while the remainder is purchased from Canadian sources.
140 mbbls/d, due to demonstrated reliability and Crude oil purchase contracts have terms ranging from
continuous improvement in operating efficiency. The month-to-month to multi-year. Approximately 58% of
Edmonton refinery has the potential to run entirely on crude oil supplied to the refinery is transported via pipeline,
feedstock sourced from oil sands and heavy crude oil from with the remainder transported via truck.
Alberta. Crude oil is supplied to the refinery via Production yield from the Commerce City refinery includes
company-owned and third-party pipelines.
primarily gasoline, distillate and asphalt. The majority of the
Feedstock is supplied from Suncor’s Oil Sands Operations, refined products are sold to commercial and wholesale
Syncrude operations (including volumes purchased by customers in Colorado and Wyoming, and a retail network
Suncor from other co-owners’ share of production) and in Colorado. Refined products are distributed by truck, rail,
other producers from the Athabasca and Cold Lake regions and pipeline.
of Alberta. The refinery can process approximately
To support the supply and demand balance in the
41 mbbls/d of blended feedstock (comprised of 29 mbbls/d Vancouver area, Suncor imports and exports finished
of bitumen and 12 mbbls/d of diluent) and process
approximately 44 mbbls/d of sour SCO. The refinery can products through its Burrard distribution terminal located
on the west coast of B.C. Suncor also enters into reciprocal
also process approximately 57 mbbls/d of sweet SCO exchange arrangements with other refiners in Western
through its synthetic train.
North America as a means of minimizing transportation
Production yield from the Edmonton refinery includes costs and balancing product availability.
primarily gasoline and distillate, which are delivered to
distribution terminals across Western Canada via the
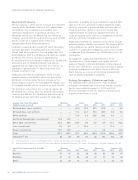
Refinery Throughputs, Utilizations and Yields
Alberta Products Pipeline, the TransMountain Pipeline and The following tables summarize the crude feedstock,
the Enbridge pipeline system, as well as via truck and rail.
utilizations and production yield mix for Suncor’s refineries
The Commerce City refinery has a crude oil capacity of for the years ended December 31, 2013 and 2012.
Refinery utilizations include the impacts of planned and
98 mbbls/d. The refinery processes primarily conventional
crude oil, but also has the capability of processing up to unplanned maintenance events.
15 mbbls/d of sour SCO from Suncor’s Oil Sands Base
Average Daily Crude Throughput Montreal Sarnia
Edmonton Commerce City
(mbbls/d, except as noted)
2013 2012
2013 2012
2013 2012
2013 2012
Oil Sands Base sweet synthetic
— —
28.0 14.5
45.5 47.6
— 0.2
.......................................................................................................................................................................................................................................................
Oil Sands Base sour synthetic — — 11.3 22.7 59.3 49.9 8.0 8.3
.......................................................................................................................................................................................................................................................
Other synthetic — — 11.6 8.3 23.6 39.2 8.9 —
.......................................................................................................................................................................................................................................................
East Coast Canada light conventional(1) 14.6 21.6 — — — — — —
.......................................................................................................................................................................................................................................................
Other light conventional 94.2 84.8 24.8 0.8 0.5 0.6 72.1 60.2
.......................................................................................................................................................................................................................................................
Sour conventional 0.2 4.7 — 22.2 — — 11.3 —
.......................................................................................................................................................................................................................................................
Heavy conventional 16.7 18.0 — — — 0.6 — 27.0
Total
125.7 129.1 75.7 68.5 128.9 137.9 100.3 95.7
Utilization(2) (%)
92 94 89 81 92
102 102 98
(1) Includes purchases of Suncor and third-party shares of production from East Coast Canada oilfields.
(2) Refinery utilizations based on crude 2013 processing capacities (in mbbls/d): Montreal – 137; Sarnia – 85; Edmonton – 140; and Commerce City – 98.
Refined Petroleum Production Yield Mix Montreal Sarnia
Edmonton Commerce City
(%)
2013 2012 2013 2012
2013 2012
2013 2012
41 41 39 39
Gasoline
43 43
49 47
.......................................................................................................................................................................................................................................................
Distillates 37 35 46 46 52 52 35 34
.......................................................................................................................................................................................................................................................
Other 22 24 15 15 5 5 16 19
24 SUNCOR ENERGY INC. ANNUAL INFORMATION FORM 2014