Page 5 - Suncor AR English
P. 5
WELCOME
Suncor is Canada’s leading integrated energy
company. Suncor’s operations include oil sands
development and upgrading, conventional and
offshore oil and gas production, petroleum reining,
product marketing under the Petro-Canada brand
and a renewable energy portfolio.
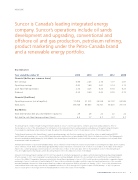
Key Indicators
Year ended December 31 2009 2010 2011 2012 2013
Financial (dollars per common share)
Net earnings
0.96
2.45
2.74
1.77
2.61
Operating earnings
0.93
1.69
3.61
3.14
3.13
Cash low from operations
2.34
4.25
6.20
6.30
6.27
Dividend
0.30
0.40
0.43
0.50
0.73
Financial ($ millions)
Operating revenues (net of royalties)
17 459
31 315
38 339
38 107
39 593
Total assets
69 746
68 607
74 741
76 401
78 315
Key Metrics
Total debt to total debt plus shareholders’ equity (%)
29
26
22
22
22
Net debt to cash low from operations (times)
4.8
1.7
0.7
0.7
0.7
This Annual Report contains forward-looking information based on Suncor’s current expectations, estimates, projections and assumptions. Refer to
the Disclaimers section of this Annual Report for information on the material risk factors and assumptions underlying our forward-looking information.
For assumptions underlying certain statements made throughout this Annual Report, refer to the Disclaimers section of this Annual Report.
Certain inancial measures in this Annual Report – namely operating earnings, cash low from operations, free cash low, return on capital employed (ROCE)
and Oil Sands cash operating costs – are non-GAAP inancial measures and therefore not prescribed by GAAP. Refer to the Advisories section of the Management’s
Discussion and Analysis dated February 28, 2014 (MD&A) of this Annual Report for deinitions of these non-GAAP measures, reconciliations to the relevant GAAP
measures and certain other advisories
All inancial information is reported in Canadian dollars, unless otherwise noted. Production volumes are presented on a working-interest basis, before royalties,
unless otherwise noted. Crude oil and natural gas liquids (NGL) volumes have been converted to mcfe or mmcfe on a one bbl to six mcf basis in this Annual
Report. Also, certain natural gas volumes have been converted to boe or mboe on the same basis. Refer to the Disclaimers section of this Annual Report.
For a list of abbreviations that may be used in this Annual Report, refer to the Advisories section of the MD&A.
Amounts in this Annual Report relating to 2010 to 2013 are based on information prepared in accordance with International Financial Reporting Standards.
Effective January 1, 2013, Suncor adopted new and amended accounting standards, deined in the Accounting Policies and Critical Accounting Estimates
section of the MD&A. Comparative igures presented in this Annual Report pertaining to Suncor’s 2012 results have been restated while comparative igures
pertaining to Suncor’s results prior to and including 2011 have not been restated in accordance with the respective transitional provisions of the new and
amended standards. Amounts for 2009 are presented in accordance with a previous GAAP in effect prior to January 1, 2011. Users of this information are
cautioned that 2009 results may not be directly comparable with those for 2010 through 2013. Figures for part of 2009 (January 1 to July 31) represent
Suncor’s results prior to the merger with Petro-Canada and do not relect the results of Petro-Canada.
SUNCOR ENERGY INC. ANNUAL REPORT 2013 1