Page 4 - Suncor AR English
P. 4
CONTENTS
2 Message to Shareholders
6 Our Competitive Differentiators
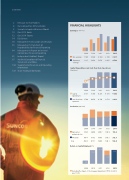
FINANCIAL HIGHLIGHTS
8 Suncor’s Integrated Business Model
Earnings ($ millions)
10 Our 2013 Goals
12 Our 2014 Targets
14 Disclaimers
16 Management’s Discussion and Analysis
83 Management’s Statement of
Responsibility for Financial Reporting
84 Management’s Report on Internal
Control over Financial Reporting
2009
2010
2011
2012
2013
85 Independent Auditor’s Report
Net earnings 1 146
3 829
4 304
2 740
3 911
87 Audited Consolidated Financial
Statements and Notes
Operating 1 115 2 634
5 674
4 847
4 700
earnings
136 Supplemental Financial and Operating
Information
Capital Expenditures and Cash Flow from Operations
147 Share Trading Information
($ millions)
2009
2010
2011
2012
2013
Capital 4 131
5 709
6 291
6 370
6 380
expenditures
Cash low from 2 799
6 656
9 746
9 733
9 412
operations
Production (mboe/d)
2009
2010
2011
2012
2013
Exploration 149.3 296.9
206.7
189.9
169.9
and production
Oil Sands 306.7
318.2
339.3
359.2
392.5
Total 456.0
615.1
546.0
549.1
562.4
Return on Capital Employed (%)
13.8
11.4
11.5
7.2
2.6
2011
2012
2013
2009 2010
Excluding the impact of the Voyageur impairment, ROCE for 2012
was 11.4%
SUNCOR ENERGY INC. ANNUAL REPORT 2013 2