Page 23 - Suncor AR English
P. 23
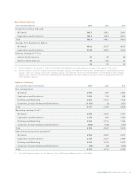
Operating Summary

Year ended December 31 2013 2012 2011

Production Volumes (mboe/d)
.......................................................................................................................................................................................................................................................
Oil Sands 392.5 359.2 339.3
.......................................................................................................................................................................................................................................................
Exploration and Production 169.9 189.9 206.7

Total 562.4 549.1 546.0

Average Price Realizations ($/boe)
.......................................................................................................................................................................................................................................................
Oil Sands 84.22 82.75 90.07
.......................................................................................................................................................................................................................................................
Exploration and Production 91.44 84.05 79.95

Refinery Utilization(1)(2) (%)
.......................................................................................................................................................................................................................................................

Eastern North America 91 89 94 .......................................................................................................................................................................................................................................................

Western North America 96 100 91

94 95 92

(1) Refinery utilization is the amount of crude oil run through crude distillation units, expressed as a percentage of the capacity of these units.
(2) Effective January 1, 2013, the company increased the nameplate capacity of the Edmonton refinery from 135,000 bbls/d to 140,000 bbls/d. Effective
January 1, 2012, the company increased the nameplate capacity of the Montreal refinery from 130,000 bbls/d to 137,000 bbls/d and the nameplate

capacity of the Commerce City refinery from 93,000 bbls/d to 98,000 bbls/d. Prior years’ utilization rates have not been recalculated and reflect the
lower nameplate capacities.


Segment Summary

Year ended December 31 ($ millions) 2013 2012 2011

Net earnings (loss)
.......................................................................................................................................................................................................................................................

Oil Sands 2 040 468 2 603 .......................................................................................................................................................................................................................................................

Exploration and Production 1 000 138 306 .......................................................................................................................................................................................................................................................

Refining and Marketing 2 022 2 137 1 726 .......................................................................................................................................................................................................................................................

Corporate, Energy Trading and Eliminations (1 151) (3) (331)
Total 3 911 2 740 4 304

Operating earnings (loss)(1)
.......................................................................................................................................................................................................................................................
Oil Sands 2 098 2 025 2 737
.......................................................................................................................................................................................................................................................
Exploration and Production 1 210 850 1 358
.......................................................................................................................................................................................................................................................
Refining and Marketing 2 022 2 152 1 726
.......................................................................................................................................................................................................................................................
Corporate, Energy Trading and Eliminations (630) (180) (147)

Total 4 700 4 847 5 674

Cash flow from (used in) operations(1)
.......................................................................................................................................................................................................................................................
Oil Sands 4 556 4 407 4 572
.......................................................................................................................................................................................................................................................
Exploration and Production 2 316 2 227 2 846
.......................................................................................................................................................................................................................................................
Refining and Marketing 2 618 3 138 2 574
.......................................................................................................................................................................................................................................................
Corporate, Energy Trading and Eliminations (78) (39) (246)

Total 9 412 9 733 9 746

(1) Non-GAAP financial measures. See the Advisories – Non-GAAP Financial Measures section of this MD&A.


SUNCOR ENERGY INC. ANNUAL REPORT 2013 19