Page 22 - Suncor AR English
P. 22
FINANCIAL AND OPERATING SUMMARY
1. FINANCIAL AND OPERATING SUMMARY
Financial Summary
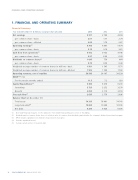
Year ended December 31 ($ millions, except per share amounts) 2013 2012 2011
Net earnings 3 911 2 740 4 304
.......................................................................................................................................................................................................................................................
per common share – basic 2.61 1.77 2.74
.......................................................................................................................................................................................................................................................
per common share – diluted 2.60 1.76 2.67
Operating earnings(1) 4 700 4 847 5 674
.......................................................................................................................................................................................................................................................
per common share – basic 3.13 3.14 3.61
Cash flow from operations(1) 9 412 9 733 9 746
.......................................................................................................................................................................................................................................................
per common share – basic 6.27 6.30 6.20
Dividends on common shares(2) 1 095 756 664
.......................................................................................................................................................................................................................................................
per common share – basic 0.73 0.50 0.43
Weighted average number of common shares in millions – basic 1 501 1 545 1 571
.......................................................................................................................................................................................................................................................
Weighted average number of common shares in millions – diluted 1 502 1 549 1 582
Operating revenues, net of royalties 39 593 38 107 38 339
ROCE(1)(3) (%)
.......................................................................................................................................................................................................................................................
For the twelve months ended 11.5 7.2 13.8
Capital Expenditures(4) 6 380 6 370 6 291
.......................................................................................................................................................................................................................................................
Sustaining 3 725 3 252 3 278 .......................................................................................................................................................................................................................................................
Growth 2 655 3 118 3 013
Free cash flow(1) 2 635 2 776 2 896
Balance Sheet (at December 31)
.......................................................................................................................................................................................................................................................
Total assets 78 315 76 401 74 741
.......................................................................................................................................................................................................................................................
Long-term debt(5) 10 660 10 249 10 016
.......................................................................................................................................................................................................................................................
Net debt 6256 6639 6976
(1) Non-GAAP financial measures. See the Advisories – Non-GAAP Financial Measures section of this MD&A.
(2) Dividends paid on common shares does not include a value for common share dividends granted under the company’s dividend reinvestment program.
(3) ROCE excludes capitalized costs related to major projects in progress.
(4) Excludes capitalized interest.
(5) Includes current portion of long-term debt.
18 SUNCOR ENERGY INC. ANNUAL REPORT 2013