Page 14 - Suncor AR English
P. 14
OUR SCORECARD
OUR 2013 GOALS
How we delivered
Suncor continued to make progress in delivering on
its strategy in 2013. We successfully leveraged our
integrated business model, generating incremental
revenues in both the upstream and downstream
in response to changing market conditions.
Continue to advance Suncor’s journey Improve maintenance and reliability
to Operational Excellence
across Suncor’s operations
Suncor’s operational excellence focus helped deliver total We completed a major turnaround in Oil Sands at our
average production of 562,400 boe/d in 2013, versus Upgrader 1 and also set an SCO production record.
549,100 boe/d in 2012. Disciplined execution of our Suncor also reduced unplanned maintenance across the
capital projects is another example of our commitment to entire business.
operational excellence; we’ve delivered almost $20 billion
worth of capital expenditures at or below projected cost in Reliability gains contributed to strong production from
Oil Sands and an overall reinery utilization rate of 94%.
the past four years.
We continue to make progress on incorporating our We completed a preventive maintenance program at Terra
Operational Excellence Management System (OEMS) into Nova, which is expected to contribute to improved reliability.
our operations.
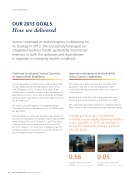
Safety performance continued to improve due to Suncor’s Through our continuous improvement
Journey to Zero program. Recordable Injury Frequency (RIF) initiatives, we are steadily improving reliability
improved to 0.56 versus 0.59 for 2012. Lost Time Injury
at our upgraders. In 2013, we achieved an
Frequency (LTIF) metrics improved to 0.05 versus 0.06
for 2012. However, the death of an employee at our Oil annual SCO production record in excess of
Sands operations in early 2014 is a sad reminder that we 280,000 bbls/d.
must be diligent in our safety journey.
0.56
0.05
Recordable Injury Frequency Rate Lost Time Injury Frequency Rate
in 2013
in 2013
10 SUNCOR ENERGY INC. ANNUAL REPORT 2013