Page 130 - Suncor AR English
P. 130
NOTES TO THE CONSOLIDATED FINANCIAL STATEMENTS
During the year ended December 31, 2013, there were no transfers between Level 1 and Level 2 fair value
measurements.
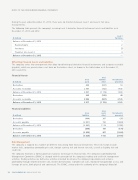
The following table presents the company’s recurring Level 3 derivative financial instrument assets and liabilities as at
December 31, 2013 and 2012:
Level 3
($ millions) Fair Value
Balance at December 31, 2012 1
.......................................................................................................................................................................................................................................................
Realized gains 2
.......................................................................................................................................................................................................................................................
Purchases (7)
.......................................................................................................................................................................................................................................................
Transfers into Level 2 4
Balance at December 31, 2013 —
Offsetting Financial Assets and Liabilities
The company enters into arrangements that allow for offsetting of derivative financial instruments and accounts receivable
(payable), which are presented on a net basis on the balance sheet, as shown in the table below as at December 31,
2013 and 2012.
Financial Assets
Gross
Gross liabilities Net amounts
($ millions)
assets offset
presented
53
Derivatives
440 (387)
.......................................................................................................................................................................................................................................................
Accounts receivable
2 567
(732)
1 835
Balance at December 31, 2012
3 007
(1 119)
1 888
225
(185)
40
Derivatives
.......................................................................................................................................................................................................................................................
Accounts receivable
3 092 (967) 2 125
Balance at December 31, 2013 3 317
(1 152)
2 165
Financial Liabilities
Gross
Gross assets Net amounts
($ millions)
liabilities
offset
presented
(484)
387
(97)
Derivatives
.......................................................................................................................................................................................................................................................
Accounts payable
(2 401)
732
(1 669)
Balance at December 31, 2012
(2 885)
1 119
(1 766)
(364)
185
(179)
Derivatives
.......................................................................................................................................................................................................................................................
Accounts payable (2 956) 967 (1 989)
Balance at December 31, 2013 (3 320) 1 152 (2 168)
Risk Management
The company is exposed to a number of different risks arising from financial instruments. These risk factors include
market risks, comprising commodity price risk, foreign currency risk and interest rate risk, as well as liquidity risk and
credit risk.
The company maintains a formal governance process to manage its financial risks. The company’s Commodity Risk
Management Committee (CRMC) is charged with the oversight of the company’s trading and credit risk management
activities. Trading activities are defined as activities intended to enhance the company’s operations and enhance
profitability through informed market calls, market diversification, economies of scale, improved transportation access, and
leverage of assets, both physical and contractual. The CRMC, acting under the authority of the company’s Board of
126 SUNCOR ENERGY INC. ANNUAL REPORT 2013