Page 129 - Suncor AR English
P. 129
• Risk Management Derivatives – The company periodically enters into derivative contracts in order to manage
exposure to commodity price and foreign exchange movements and are a component of the company’s overall
risk management program.
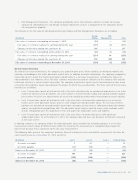
The Changes in the fair value of non-designated Energy Trading and Risk Management derivatives are as follows:
Energy Risk
($ millions) Trading Management Total
Fair value of contracts outstanding at January 1, 2012 (34) — (34)
.......................................................................................................................................................................................................................................................
Fair value of contracts realized in earnings during the year (255) (2) (257)
.......................................................................................................................................................................................................................................................
Changes in fair value during the year (note 8) 246 1 247
Fair value of contracts outstanding at December 31, 2012 (43) (1) (44)
.......................................................................................................................................................................................................................................................
Fair value of contracts realized in earnings during the year (271) 18 (253)
.......................................................................................................................................................................................................................................................
Changes in fair value during the year (note 8) 176 (18) 158
Fair value of contracts outstanding at December 31, 2013 (138) (1) (139)
(b) Fair Value Hierarchy
To estimate fair value of derivatives, the company uses quoted market prices when available, or third-party models and
valuation methodologies that utilize observable market data. In addition to market information, the company incorporates
transaction specific details that market participants would utilize in a fair value measurement, including the impact of
non-performance risk. However, these fair value estimates may not necessarily be indicative of the amounts that could be
realized or settled in a current market transaction. The company characterizes inputs used in determining fair value using
a hierarchy that prioritizes inputs depending on the degree to which they are observable. The three levels of the fair value
hierarchy are as follows:
• Level 1 transactions consist of instruments with a fair value determined by an unadjusted quoted price in an active
market for identical assets or liabilities. An active market is characterized by readily and regularly available quoted
prices where the prices are representative of actual and regularly occurring market transactions to assure liquidity.
• Level 2 transactions consist of instruments with a fair value that is determined by quoted prices in an inactive
market, prices with observable inputs, or prices with insignificant non-observable inputs. The fair value of these
positions are determined using observable inputs from exchanges, pricing services, third-party independent broker
quotes, and published transportation tolls. The observable inputs may be adjusted using certain methods, which
include extrapolation over the quoted price term and quotes for comparable assets and liabilities.
• Level 3 transactions consist of instruments with a fair value that is determined by prices with significant
unobservable inputs. As at December 31, 2013, the company does not have any derivative instruments measured
at fair value Level 3.
In forming estimates, the company utilizes the most observable inputs available for valuation purposes. If a fair value
measurement reflects inputs of different levels within the hierarchy, the measurement is categorized based upon the
lowest level of input that is significant to the fair value measurement.
The following table presents the company’s derivative financial instrument assets and liabilities measured at fair value for
each hierarchy level as at December 31, 2013 and 2012.
($ millions) Level 1 Level 2 Level 3 Total Fair Value
Accounts receivable 5 47 1 53
.......................................................................................................................................................................................................................................................
Accounts payable
(12) (85) — (97)
Balance at December 31, 2012
(7) (38)
1 (44)
Accounts receivable
137 88
— 225
.......................................................................................................................................................................................................................................................
Accounts payable (165) (199) — (364)
Balance at December 31, 2013 (28) (111) — (139)
SUNCOR ENERGY INC. ANNUAL REPORT 2013 125