Page 116 - Suncor AR English
P. 116
NOTES TO THE CONSOLIDATED FINANCIAL STATEMENTS
Dec 31, 2013
Dec 31, 2012
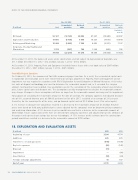
Accumulated Net book Accumulated Net book
($ millions)
Cost
provision
value
Cost
provision
value
(restated –
note 6)
52 127
(12 125)
40 002
47 337
(10 440)
36 897
Oil Sands
.......................................................................................................................................................................................................................................................
Exploration and Production 15 660 (6 704) 8 956 16 335 (5 691) 10 644
.......................................................................................................................................................................................................................................................
Refining and Marketing 10 449 (2 883) 7 566 9 462 (2 355) 7 107
.......................................................................................................................................................................................................................................................
Corporate, Energy Trading and
Eliminations 1 313 (567) 746 1 234 (448) 786
79 549 (22 279) 57 270 74 368 (18 934) 55 434
At December 31, 2013, the balance of assets under construction, and not subject to depreciation or depletion, was
$11.1 billion (December 31, 2012 – $12.2 billion; January 1, 2012 – $16.2 billion).
At December 31, 2013, Property, Plant and Equipment included finance leases with a net book value of $997 million
(December 31, 2012 – $831 million; January 1, 2012 – $425 million).
Fort Hills Project Sanction
On October 30, 2013, the co-owners of Fort Hills announced project sanction. As a result, the accumulated capital costs
in exploration and evaluation assets were transferred to oil and gas properties in Property, Plant and Equipment and an
impairment test was required in accordance with IFRS 6 Exploration for and Evaluation of Mineral Resources. A fair value
less costs of disposal methodology was used to determine the recoverable amount and, as it exceeded the carrying
amount, no impairment was recorded. Key assumptions used in the calculation of the recoverable amount were bitumen
price, future capital costs and discount rate. The assumptions used by management to calculate the recoverable amount
may change. Changes in these assumptions will have an impact on the recoverable amount and may result in impairment.
For purposes of calculating the recoverable amount at the date of sanction, the company applied a risk-adjusted discount
rate of 8%, assumed bitumen price of $64.00 per barrel at first oil in 2017, escalated at an average of 2% per year
thereafter, for the remaining life of the mine, and go forward capital costs of $5.5 billion (Level 3 fair value inputs).
A 1% increase in discount rate would have resulted in a decrease to the recoverable amount of $1.0 billion. Bitumen
prices were based on third party published price curves adjusted for the company’s view on long-term pricing economics
and marketing information. A 5% decrease in prices would have resulted in a decrease to the recoverable amount of
$800 million. Future capital costs of the mine are derived from company experience and adjusted for specific attributes of
the project and expected cost savings due to new technologies. A 15% increase to this estimate (over the construction
period) would have resulted in a decrease to the recoverable amount of $700 million.
18. EXPLORATION AND EVALUATION ASSETS
($ millions) 2013 2012
Beginning of year 3 284 4 554
.......................................................................................................................................................................................................................................................
Additions 225 478
.......................................................................................................................................................................................................................................................
Transfers to oil and gas assets (644) (1 598)
.......................................................................................................................................................................................................................................................
Dry hole expenses (82) (145)
.......................................................................................................................................................................................................................................................
Disposals (11) —
.......................................................................................................................................................................................................................................................
Impairment — (88)
.......................................................................................................................................................................................................................................................
Amortization (13) (24)
.......................................................................................................................................................................................................................................................
Foreign exchange adjustments 13 107
End of year 2 772 3 284
112 SUNCOR ENERGY INC. ANNUAL REPORT 2013