Page 114 - Suncor AR English
P. 114
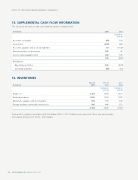
NOTES TO THE CONSOLIDATED FINANCIAL STATEMENTS


15. SUPPLEMENTAL CASH FLOW INFORMATION


The (increase) decrease in non-cash working capital is comprised of:


($ millions)
2013 2012
(restated –
note 6)

(60) 193 Accounts receivable
.......................................................................................................................................................................................................................................................
Inventories (220) 460
.......................................................................................................................................................................................................................................................
Accounts payable and accrued liabilities 69 (1 729)
.......................................................................................................................................................................................................................................................
Current portion of provisions 206 45
.......................................................................................................................................................................................................................................................
Income taxes payable (net) 603 106

598 (925)

Relating to:
.......................................................................................................................................................................................................................................................
Operating activities 688 (874)
.......................................................................................................................................................................................................................................................
Investing activities
(90)
(51)


16. INVENTORIES


Dec 31 Dec 31 Jan 1
($ millions)
2013
2012
2012

(restated – (restated –
note 6)
note 6)

1 269
1 091
1 321
Crude oil
.......................................................................................................................................................................................................................................................
Refined products 1 695 1 523 1 705
.......................................................................................................................................................................................................................................................
Materials, supplies and merchandise 594 597 592
.......................................................................................................................................................................................................................................................
Energy trading commodity inventories 386 486 551

3 944 3 697 4 169


During 2013, product inventories of $18.0 billion (2012 – $17.7 billion) were expensed. There was no inventory

write-down during 2013 (2012 – $45 million).


110 SUNCOR ENERGY INC. ANNUAL REPORT 2013