Page 71 - MIC 2014 - English
P. 71
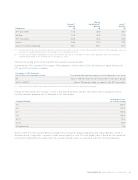
Market
(1) (2) (1)
RevenueCapitalizationAssets
(Billions) (Billions) (Billions)
Distribution ($) ($) ($)

25th percentile 11.6 30.9 36.7
.......................................................................................................................................................................................................................................................

Median 13.9 38.9 51.4
.......................................................................................................................................................................................................................................................

75th Percentile 33.8 85.2 97.3
Suncor 29.8 55.3 77.8
.......................................................................................................................................................................................................................................................
Suncor Percentile Ranking 73% 67% 73%


(1) Percentile rank for Revenue and Assets is based on information reported for the nine months ended September 30, 2013. Where applicable, values are
converted to Canadian dollars based on the exchange rate on September 30, 2013.
(2) Percentile rank for Market Capitalization is based on information reported as of December 31, 2013. Where applicable, values are converted to

Canadian dollars based on the exchange rate on December 31, 2013.

The basis for vesting of the 2012 and 2013 PSU awards is described below:

Vesting for the 2012 award of PSUs requires TSR performance relative to the 2012 PSU award peer group between the

25th and 100th percentiles as follows:


Percentage of PSUs Vesting at
End of Three-Year Performance Period Total Shareholder Return Performance Period Compared to Peer Group

Nil Suncor TSR less than the 25th percentile of the peer group
.......................................................................................................................................................................................................................................................
50% to 200%(1) Suncor TSR greater than or equal to the 25th percentile

(1) Payout is based on actual interpolated position between the 25th percentile and the top performing company.


Vesting for PSU awards after January 1, 2013 is determined based on Suncor’s TSR relative to peer companies and its
resulting company grouping rank as displayed in the table below.


Performance Factor
Company TSR Rank (% of PSUs vesting)

1-3 200%
.......................................................................................................................................................................................................................................................
4-5 175%
.......................................................................................................................................................................................................................................................
6-7 150%
.......................................................................................................................................................................................................................................................
8-9 100%
.......................................................................................................................................................................................................................................................
10-11 75%
.......................................................................................................................................................................................................................................................
12-13 50%
.......................................................................................................................................................................................................................................................
14 and below 0%


At the end of the three-year performance period, TSR is measured, company grouping rank and performance factor is
determined and, if applicable, a payout is made to participants in cash. The final payout value is based on the number of

vested PSUs multiplied by the market price of a Suncor common share, as calculated under the PSU Plan provisions.


SUNCOR ENERGY INC. MANAGEMENT PROXY CIRCULAR 2014 69