Page 60 - MIC 2014 - English
P. 60
EXECUTIVE COMPENSATION
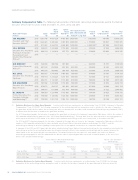
Summary Compensation Table. The following table provides information concerning compensation paid to the Named
Executive Officers for the years ended December 31, 2013, 2012 and 2011.
Share- Option- Non-equity incentive
Based Based plan compensation ($)
Pension All Other Total
Name and Principal Salary Awards(1)(3) Awards(2)(3) Value(5) Compensation(6) Compensation(3)
Position
Year ($) ($)
($)
Annual(4) Long-Term
($)
($)
($)
S.W. WILLIAMS
149560
2013 1291346 4687224 4453600 2420000 — (162500)
12839230
....................................................................................................................................................................................................
President and Chief 2012 1222423 3436242 3435869 2080000 — 1570600 138801 11883935
Executive Officer(7)
....................................................................................................................................................................................................
2011 811923 2224733 2226960 1300000 — 3644100(8) 107848 10315564
S.D.L. REYNISH
2013 520 673 1 233 480 1 172 000 530 000 — 370 300 37 836 3 864 289
Executive Vice President, ....................................................................................................................................................................................................
Strategy & Corporate 2012 496 154 1 124 418 875 773 485 000 — 279 400 150 000 3 410 745
....................................................................................................................................................................................................
2011 — — — — — — — —
Development and
Interim Chief Financial
Officer(9)
B.W. DEMOSKY
2013 524 808 986 784 937 600 — — 624 300 35 557 3 109 049
....................................................................................................................................................................................................
Former Chief Financial 2012 491 538 654 029 653 562 435 000 — 562 400 36 385 2 832 914
Officer(10)
....................................................................................................................................................................................................
2011 443 538 889 893 890 784 420 000 — 373 000 79 374 3 096 589
M.S. LITTLE
2013 603 077 1 541 850 1 465 000 700 000 — 814 000 50 797 5 174 724
Executive Vice President, ....................................................................................................................................................................................................
Upstream
2012 558 154 1 214 225 1 213 758 580 000 — 727 000 47 721 4 340 858
....................................................................................................................................................................................................
2011 492 731 1 112 367 1 113 480 610 000 — 594 200 92 568 4 015 346
M.R. MACSWEEN
2013 503 942 1 233 480 1 172 000 540 000 — 751 400 33 952 4 234 774
Executive Vice President, ....................................................................................................................................................................................................
2012 474 673 934 127 933 660 485 000 — 971 600 34 094 3 833 154
Major Projects
....................................................................................................................................................................................................
2011 384 077 611 969 612 414 400 000 — 466 300 73 722 2 548 482
B.J. JACKSON
2013 568 269 1 233 480 1 172 000 600 000 — 134 100 28 923 3 736 772
....................................................................................................................................................................................................
Former Executive Vice 2012 750000 1120392 1120392 1000000 — 254600 37978 4283362
President, Refining ....................................................................................................................................................................................................
and Marketing(11)
2011 750 000 1 001 130 1 002 132 1 000 000 — 180 700 89 169 4 023 131
(1) Valuation Disclosure for Share-Based Awards. Consistent with disclosure requirements, as outlined under Form 51-102F6 – Statement of Executive
Compensation (‘‘Form 51-102F6’’), the following summarizes (a) the methodology and key assumptions used to calculate the fair value of awards at
the grant date and (b) discloses where the accounting fair value, as determined in accordance with International Financial Reporting Standards (‘‘IFRS’’),
is different than the fair value of awards at the grant date and why.
For 2013 share-based awards, the fair value of awards at the grant date, as shown in the Summary Compensation Table above, reflects the number of
PSUs awarded multiplied by the grant price (the ‘‘2013 Share-Based Methodology’’). This may differ from the value reported for accounting purposes,
which reports a fair value for PSUs based on the Monte Carlo simulation methodology at the end of each period, in accordance with IFRS.
For 2012 and 2011 share-based awards, the fair value of awards at the grant date, as shown in the Summary Compensation Table above, reflects the
number of PSUs awarded multiplied by the value calculated using Towers Watson’s binomial valuation methodology. The HR&CC used this
methodology in making its decisions regarding incentive grants since it was applied consistently in its competitive market analysis.
A summary of the 2012 and 2011 grant date fair values calculated using Towers Watson’s binomial methodology, the key assumptions used under this
methodology as well as the accounting fair values (as determined using the Monte Carlo simulation methodology) and the variance between the
values based on the two methodologies is provided below. The variance between the two values for each award is the result of a different
methodology being applied to value the awards and the date the value is reported (grant date versus end of financial quarter, in the case of the
Monte Carlo Simulation Methodology).
Towers Watson’s Binomial Methodology Monte Carlo Simulation
Key Assumptions
Methodology
Variance to
Grant Date Performance Accounting Grant Date
Fair Value Range Dividend Fair Value Fair Value
Year and Plan
($)
Term
Vesting
(%)
Turnover
Reinvestment
($)
($)
28.01
3 years
Cliff
0 – 200
5%
Yes
25.49
(2.52)
2012 – PSU Plan
.............................................................................................................................................................................................................................................
2011 – PSU Plan 33.40 3 years Cliff 0 – 200 5% Yes 40.82 7.42
(2) Valuation Disclosure for Option-Based Awards. Consistent with disclosure requirements, as outlined under Form 51-102F6, the following
summarizes (a) the methodology and key assumptions used to calculate the fair value of awards at the grant date and (b) discloses where the
58 SUNCOR ENERGY INC. MANAGEMENT PROXY CIRCULAR 2014