Page 56 - MIC 2014 - English
P. 56
EXECUTIVE COMPENSATION
Executive Compensation Alignment with Shareholder Value
The Board recognizes that in an industry subject to commodity price cycles, Suncor’s focus is on long-term shareholder
value growth. Suncor’s common shares were valued at $37.24 on the TSX at December 31, 2013, an increase of
approximately 13.8% over the year before. From 2008 to 2013, Suncor’s share price increased by approximately 57%.
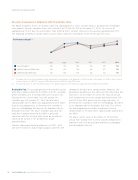
The following performance graph shows Suncor’s total cumulative shareholder return for the past five years.
Performance Graph(1)(2)
2008 2009 2010 2011 2012 2013
Suncor Energy Inc. 100 158 165 128 145 153
S&P/TSX Composite (TRIV) Index 100 135 159 145 155 176
S&P/TSX Energy (TRIV) Index 100 139 158 142 142
161
18FEB201418201811
(1) The graph reflects the total cumulative return, assuming the reinvestment of all dividends, of $100 invested on December 31, 2008 in each of Suncor
common shares, the S&P/TSX Composite (TRIV) Index and the S&P/TSX Energy (TRIV) Index.
(2) The year-end values of each investment shown on the graph are based on the share price appreciation plus dividend reinvestment.
Realizable Pay. The pay opportunity and realizable pay for component of total direct compensation. However, this
total direct compensation for the NEOs, with the exception operational performance has not been fully reflected in our
of Mr. Demosky, over the period from 2011 to 2013 are share price. At December 31, 2013, the value of annual
illustrated in the chart below. Over this period, the mid- to long-term incentive awards granted between 2011
realizable pay at December 31, 2013 for total direct and 2013 was 29% lower than the expected value, as
compensation for the NEOs was approximately 20% lower determined in accordance with the methodology described
than the pay opportunity, as determined in accordance in the footnotes for the Realizable Pay chart. This reflects
with the methodology described in the footnotes for the the high proportion of variable, performance based
Realizable Pay chart. The lower realizable pay value for compensation in the total direct compensation provided to
total direct compensation for the NEOs is generally the NEOs.
consistent with the trend of total return on investment The lower current value at December 31, 2013 of the
indicated for Suncor in the performance graph
provided above.
annual mid- to long-term incentive awards demonstrates
alignment with Suncor’s pay-for-performance philosophy
Suncor’s strong operational performance in 2011, 2012 and shareholder interests.
and 2013 resulted in above target payouts under the AIP
54 SUNCOR ENERGY INC. MANAGEMENT PROXY CIRCULAR 2014